Archived - AANDC Quarterly Financial Report - For the quarter ended December 31, 2012
Archived information
This Web page has been archived on the Web. Archived information is provided for reference, research or record keeping purposes. It is not subject to the Government of Canada Web Standards and has not been altered or updated since it was archived. Please contact us to request a format other than those available.
1. Introduction
This quarterly financial report has been prepared by management as required by section 65.1 of the Financial Administration Act and in the form and manner prescribed by the Treasury Board. It should be read in conjunction with the Main Estimates and Supplementary Estimates (A) and (B) for fiscal year 2012-13 as well as Canada's Economic Action Plan 2012 (Budget 2012). For purposes of both the Main and Supplementary Estimates, the Department is referred to as Indian Affairs and Northern Development.
The quarterly financial report has not been subject to an external audit or review.
1.1 Authority, Mandate and Program Activities
Aboriginal Affairs and Northern Development Canada (AANDC) supports Aboriginal people (First Nations, Inuit and Métis) and Northerners in their efforts to:
- Improve social well-being and economic prosperity;
- Develop healthier, more sustainable communities; and
- Participate more fully in Canada's political, social and economic development – to the benefit of all Canadians.
AANDC is one of the federal departments responsible for meeting the Government of Canada's obligations and commitments to First Nations, Inuit and Métis, and for fulfilling the federal government's constitutional responsibilities in the North. AANDC's responsibilities are largely determined by numerous statutes, negotiated agreements and legal decisions.
Most of the Department's program spending is delivered through partnerships with Aboriginal communities and federal-provincial or federal-territorial agreements. AANDC also works with urban Aboriginal persons, Métis and Non-Status Indians (many of whom live in rural areas) through the Office of the Federal Interlocutor.
Further details on AANDC's authority, mandate and program activities can be found in Part II of the Main Estimates and the Report on Plans and Priorities.
1.2 Basis of Presentation
This quarterly report has been prepared by management using an expenditure basis of accounting and a special purpose financial reporting framework designed to meet financial information needs with respect to the use of spending authorities. The accompanying Statement of Authorities includes AANDC's spending authorities granted by Parliament and those used by the Department consistent with the Main Estimates and Supplementary Estimates (A) and (B) as well as the Operating Budget Carry Forward, the Capital Budget Carry Forward, Reimbursement of Paylist Requirements and Compensation Adjustments for the 2012-2013 fiscal year.
The authority of Parliament is required before monies can be spent by the Government. Approvals are given in the form of annually approved limits through appropriation acts or through legislation in the form of statutory spending authority for specific purposes.
As part of the Parliamentary business of supply, the Main Estimates must be tabled in Parliament on or before March 1 preceding the new fiscal year. Budget 2012 was tabled in Parliament on March 29, after the tabling of the Main Estimates on February 28, 2012. As a result the measures announced in the Budget 2012 are not reflected in the 2012-13 Main Estimates.
In fiscal year 2012-2013, frozen allotments have been established by Treasury Board authority in departmental votes to prohibit the spending of funds already identified as savings measures in Budget 2012. In future years, the changes to departmental authorities will be implemented through the Annual Reference Level Update, as approved by Treasury Board, and reflected in the subsequent Main Estimates tabled in Parliament.
The Department uses the full accrual method of accounting to prepare and present its annual departmental financial statements that are part of the departmental performance reporting process. However, the spending authorities voted by Parliament remain on an expenditure basis.
1.3 AANDC's Financial Structure
The parliamentary vote structure of AANDC is made up of $8.4 billion in budgetary authorities of which $8.3 billion requires approval by Parliament; referred to as voted amounts. The remaining $164.7 million represents statutory authorities that do not require additional approval and are provided for information purposes.
Voted amounts totalling $8.3 billion are split between Operating Expenditures, Capital Expenditures and Grants and Contributions as follows:
- Operating Expenditures represents approximately $1.5 billion (17.7%), this includes $563.4 million (6.8%) for the Settlement Allotment (Independent Assessment Process and Alternative Dispute Resolution)
- Capital represents approximately $23.0 million (0.3%)
- Grants and Contributions represent approximately $6.8 billion (82.0%)
More detailed information about AANDC's financial structure, including information about the fiscal cycle, cost drivers, expenditure trends, etc. can be found online.
2. Highlights of Fiscal Quarter and Fiscal Year-to-Date (YTD) Results
This section highlights the significant items that contributed to the net increase or decrease in resources available for the year and actual expenditures for the quarter ended December 31, 2012. The explanation of variances considers that changes under 5% would have minimal impact on interpretation of results.
2.1 Statement of Authorities (Table 1)
As displayed in Table 1, the total year-to-date authorities available for use in the third quarter of 2012-13 were $8,516.1 million compared to $7,977.0 million for the same quarter of the prior year, representing an increase in Departmental authorities of $539.1 million. The total 2012-13 year-to-date authority increase of $539.1 million over 2011-12 can be explained by the following major items:
| Program | Increase / (Decrease) in Authorities Available For Use ($ millions) |
|||||
|---|---|---|---|---|---|---|
| Operating * | Capital | Grants and Contributions * |
Non-Budgetary | Total | ||
| * Includes statutory authorities
** e.g. Mi'kmaq education in Nova Scotia, Northwest Territories land and resources devolution, Canadian High Arctic Research Station, Canada's Clean Air Agenda, First Nations Schoolnet Youth Initiatives, Nutrition North Canada program and Urban Aboriginal Strategy. Note: Figures may not add due to rounding |
||||||
| a. | Funding for negotiation, settlement and implementation of specific and comprehensive claims | (17.6) | 4.3 | 374.3 | 0.8 | 361.8 |
| b. | Funding for awards to claimants resulting from the Independent Assessment Process and Alternative Dispute Resolution related to the Indian Residential Schools Settlement Agreement | 141.1 | 6.9 | 148.0 | ||
| c. | Funding to meet increased demand for ongoing Indian and Inuit programs providing access to basic services such as education and social support services | 0.3 | 98.6 | 98.9 | ||
| d. | Funding for the development of systems and supports to ensure readiness for First Nation education legislation and to support the construction and/or renovation of schools on reserve | 45.0 | 45.0 | |||
| e. | Transfer from Canadian Heritage for the Urban Aboriginal Youth and Community Unit | 0.8 | 38.7 | 39.5 | ||
| f. | Funding for the assessment, management and remediation of federal contaminated sites | 13.5 | 15.2 | 28.7 | ||
| g. | Operating Budget Carry Forward / Capital Budget Carry Forward | 25.2 | 1.0 | 26.2 | ||
| h. | Funding to support tripartite education agreements with First Nations in British Columbia and to advance readiness for education comparability in other provinces through the Education Partnerships Programs | (0.9) | 16.6 | 15.7 | ||
| i. | Other various initiatives (net) ** | (9.4) | 2.9 | 15.4 | 8.8 | |
| j. | Decrease in funding for on-reserve costs incurred by provincial/territorial or other emergency management organizations as required under the Emergency Management Assistance Program | (95.4) | (95.4) | |||
| k. | Decrease in funding for First Nations Infrastructure Fund | (0.7) | (39.9) | (40.6) | ||
| l. | Reimbursement of paylist requirements | (34.1) | (34.4) | |||
| m. | Savings identified as part of the Budget 2012 Spending Review | (19.5) | (4.4) | (23.9) | ||
| n. | Decrease in funding for First Nations Water and Wastewater Action Plan | (1.9) | (20.8) | (22.7) | ||
| o. | Decrease in the transfer of funding to Shared Services Canada for information technology services | (16.8) | (16.8) | |||
| q | Total increase / (decrease) to Departmental Authorities | 79.9 | 8.2 | 450.2 | 0.8 | 539.1 |
As shown in the table above, the total 2012-13 year-to-date authority increase of $539.1M over 2011-12 is primarily attributed to an increase of $79.9M in Operating expenditures and $450.2M in Grants and Contributions:
- The increase of $79.9M in Operating expenditures is primarily due to the $141.1M increase in funding for the Indian Residential Schools Settlement Agreement and the $25.2M increase in Operating Budget Carry Forward. These increases are partially offset by the $34.1M decrease in reimbursement of paylist requirements, the $19.5M saving identified as part of the Budget 2012-13 Spending Review, the $17.6M decrease in funding for claims activities and the $16.8M decrease in funding for the transfer to Shared Services Canada for information technology services.
- The increase of $450.2M in Grants and Contributions is primarily due to the $374.4M increase in funding for claims activities, notably for the $307.2M settlement of the Coldwater-Narrows Specific Claim, $98.6M in funding to meet increased demand for ongoing Indian and Inuit programs providing access to basic services such as education and social support services and the $45M increase in funding for the development of systems and supports to ensure readiness for First Nation education legislation and to support the construction and/or renovation of schools on reserve. These increases are partially offset by the $95.4M decrease in funding for the Emergency Management Assistance Program.
2.2 Statement of Departmental Budgetary Expenditures by Standard Object (Table 2)
Highlights of Fiscal Quarter ended December 31, 2012
Departmental spending in the third quarter of 2012-13 was $265M higher than the same period in 2011-12. This net increase of 14% can be attributed mainly to increases of: $217M in transfer payments (standard object 10), $63M in other subsidies and payments (standard object 12), and $5M in the acquisition of land, buildings and works (standard object 8). These increases were offset by decreases of: $10M in professional and special services (standard object 4), $6M in personnel (standard object 1), $4M in transportation and communications (standard object 2) and $3M in other activities including rentals, repair and maintenance, and acquisition of machinery and equipment.
The net increase of $217M in transfer payments is related primarily to specific claims settlements. During the third quarter of 2012-13 there were 8 specific claims settlements totalling $393M, which was largely made up of the settlement for the Coldwater Narrows Specific Claim. In the third quarter of 2011-12 there were 2 settlement payments totaling $6M, one to the Heiltsuk Band for $3M and one to the Yale First Nation for $3M. The net increase of $387M in the third quarter of 2012-13 was offset by a decrease in transfer payments of $10M in operations funding to First Nations for facilities and housing, in addition to transfer payment decreases related to the timing of:
- the payment to the Québec government for the James Bay Northern Québec Agreement for Education ($93M),
- emergency management activities on reserve ($37M),
- grant payments to the Governments of Nunavut and the Northwest Territories for hospital and physician services ($26M), and
- payments related to providing assistance in accessing healthy foods in isolated northern communities ($4M).
The third quarter increase of $63M in other subsidies and payments is a result of an increase of $21M in payment of claimant awards, primarily related to the Indian Residential Schools Settlement and an increase of $42M related to the timing of the clearing of transactions in the interdepartmental settlement suspense accounts.
The third quarter increase of $5M in the acquisition of land, buildings and works relates to the 2012-13 purchase of land for inclusion in the K'omoks First Nation's land package and settlement. This transaction is a cost-sharing agreement between the Department and the Province of British Columbia. The agreement was structured with the Department paying the full price of the land up front and will result in an ultimate 50:50 cost share with the Province.
The third quarter decrease of $10M in professional and special services can be attributed primarily to reduced expenditures in the third quarter of 2012-13 due to the timing of billings for litigation services from the Department of Justice.
The third quarter decrease of $5M in personnel costs is as a result of reduced expenditures of $3M in severance pay costs related to the 2012 Immediate Settlement of Civilian severance pay and termination benefits and the transfer of staff to Shared Services Canada in 2011-12 representing a $2M decrease.
Lastly, the third quarter decreases of $3M in transportation and communications costs and $2M in other activities such as information, rentals, repair and maintenance, utilities, materials and supplies, and acquisition of machinery and equipment are a result of ongoing cost containment measures adopted by the department.
Highlights of Fiscal Year-to-Date (YTD) Results
Year-to-date total departmental spending resulted in a net increase of $162M which is attributable to an increase in spending of $150M in the first quarter, a decrease in spending of $251M in the second quarter and an increase of $263M in the third quarter. The net increase in expenditures is primarily due to activities related to the negotiation and timing of the settlement of specific claims.
($ millions)
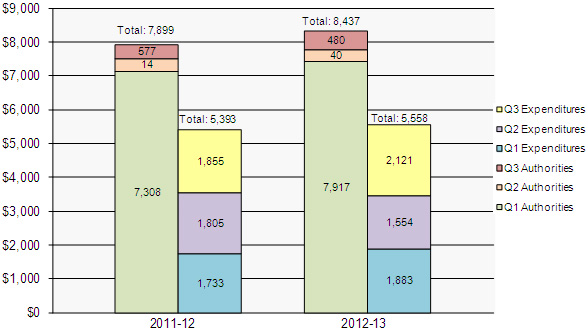
Description of figure: Year-to-Date Comparison of Budgetary Authorities and Expenditures as of December 31, 2012
This image is of a bar graph of the year-to-date comparison of budgetary authorities and expenditures as of the end of December 31st, 2012. The graph plots the authorities and expenditures by quarter arriving at a year to date total for the fiscal years 2011–12 and 2012–13.
The 2011–12 data shows the Q3 authorities equaling the Main Estimates, the Supplementary Estimates A and B authorities, and the Operating Budget Carry Forward arriving at the total authority at the end of Q3 of $7,899M. The 2012–2013 data shows the Q3 authorities equaling the Main Estimates, the Supplementary Estimates A and B authorities, the Operating Budget Carry Forward and the Capital Budget Carry Forward arriving at the total authority at the end of Q3 of $8,437M.
The net difference in comparing the authorities at the end of Q3 each fiscal year is an increase of $538M from 2011–12 to 2012–13.
The second column of each section of the graph pertains to expenditures. The 2011–12 data shows the Q1 expenditures of $1,733M, the Q2 expenditures of $1,805M and the Q3 expenditures of $1,855M arriving at a total of $5,393M. The 2012–13 data shows the Q1 expenditures of $1,883M, the Q2 expenditures of $1,554M and the Q3 expenditures of $2,121M arriving at a total of $5,558. The net difference in comparing the expenditures at the end of Q3 each fiscal year is an increase of $165M from 2011–12 to 2012–13.
3. Risks and Uncertainties
In the last year, the Department has undertaken a number of initiatives to ensure that programs are streamlined, properly responding to the needs of the ever growing and youthful Aboriginal demographic, and speaking to outcomes in a time of fiscal restraint.
To this end, risk management and risk-based decision-making have become a critical component in the way Department prioritizes and conducts its business. AANDC is currently in the process of testing its controls at the entity and financial levels. A detailed approach and methodology was developed over the last two quarters with the final analysis expected to be complete by Q4. In addition to control testing, resource allocation decisions across the Department are reviewed and approved by senior management.
The Department's Corporate Risk Profile was updated in August 2012. The process included a review of previously completed regional, program and sector risk assessments, audits, evaluations and control self-assessments as well as targeted interviews with senior management in those areas experiencing significant change or that play key roles on horizontal files. AANDC senior management were actively involved in defining the risks, risk drivers and consequences to ensure the current realities of AANDC's internal and external operating environment are well reflected.
Aboriginal Relationship Risk was the only risk area assessed as very high by the Department. While the potential consequences are significant, several mitigation strategies are being proposed for the coming year. Program renovation initiatives (including revamping funding mechanisms), the streamlining of departmental processes as a result of Expenditure Management activities, and the implementation of risk-based approaches to recipient monitoring and reporting should help the Department conduct business more efficiently and effectively. This streamlining will mean less frustration for clients, reduced administrative burden and a reduction in the duplication of effort to access program funding.
Four risk areas were assessed as high. The proposed mitigation strategies for HR Capacity and Capabilities Risk include the development and implementation of workplace wellness initiatives, implementation of the AANDC Learning and Training Strategy and the development of inter-departmental staff exchanges. Information for Decision-making Risk deals with possibility that the Department might not have the information it needs in order to fulfill its obligations. To this end, efforts on reducing and streamlining recipient reporting will continue where possible. This includes plans to work with Health Canada on the integration of key data systems including financial reporting. Environmental Risk relates to the possibility that the Department may not be able to manage environmental issues and liabilities in a timely and cost effective manner. Mitigation strategies for this risk include ongoing support for Northern environmental monitoring programs and the Nunavut General Monitoring Plan. The Department is also proposing additional governance processes for major Northern projects. The Department plans to pilot Community Land Use Planning which should increase attention to infrastructure and environmental issues in the North.
The last assessed as high is Legal Risk. The Department leads on a number of policies and programs that have been established as a matter of social or economic policy and may accordingly be exposed to more complex legal risk than those defined by statute. The Department has undertaken work to ensure that risks and potential impacts of litigation are better mitigated, including a proactive outreach initiative that advises senior management about upcoming litigation so that potential effects on Departmental programs are given full consideration. The Department will also continue to work regularly with the Department of Justice in order to better manage emerging legal issues.
The remaining four risks (Implementation, Government Partnership, External Partnership and Resource Alignment) were assessed as moderate. While these risks may not have the same likelihood of occurrence or impact on to the Department, it is acknowledged that they have the potential to drive other risks. As such, the mitigation listed in these four areas can be implemented in conjunction with and in support of strategies tied to other risk areas.
Each of the corporate risk areas has been assigned to a risk lead in order to plan and implement mitigation activities. Corporate and financial risk mitigation activities are reflected in the Corporate Business Plan and are monitored by senior management on a quarterly basis and modified as required. Cost containment measures are monitored monthly and a review and challenge function is done monthly through the Financial Status Report. A number of CFO Sector controls help to manage risk departmentally, including regular meetings of the Financial Management Committee, the recent development of the Policy on Internal Controls, and existing policies and procedures regarding the selection, control management and due diligence requirements in a number of areas. In addition to corporate risk profiling, individual risk assessments are being conducted at the program level in order to mitigate each program's residual risks. At the end of the third quarter, nine regions have risk profiles in place.
4. Significant changes in relation to Operations, Personnel and Programs
Significant changes in relation to Operations, Personnel and Programs during the third quarter of fiscal year 2012-13 include:
- Pursuant to section 31.1 of the Financial Administration Act and Order-in-Council P.C. 2011-1297 effective November 15, 2011, $9,606 thousand was transferred from Aboriginal Affairs Canada to Shared Services Canada's Operating Vote and the Department's reference levels were reduced by $26.4 million at the beginning of the 2012-13 fiscal year.
- Élisabeth Châtillon, Assistant Deputy Minister, Resolution and Individual Affairs retired from the Public Service at the end of December. Andrew Saranchuk is currently on assignment as the interim Assistant Deputy Minister.
- Shelley Trevethan has succeeded Akivah Starkman as the Executive Director, Indian Residential Schools Adjudication Secretariat.
- Bernard Etzinger has been appointed Director General, Communications.
5. Budget 2012 Implementation
This section provides an update of the savings measures announced in Budget 2012 that are being implemented in order to refocus government and programs; make it easier for Canadians and business to deal with their government; and, modernize and reduce the back office.
Aboriginal Affairs and Northern Development Canada will achieve savings of $24.4 million in the first year. Savings will increase to $55.1 million in 2013-14 and will result in ongoing savings of $160.6 million by 2014-15.
For the quarter ending December 31, 2012, Budget 2012 impacts on the Department's authorities as approved in the Main Estimates and Supplementary Estimates (A) and (B) 2012-2013 have been minimal.
There are no significant financial risks or uncertainties related to Budget 2012 savings for this quarterly financial report. AANDC continues to manage the implementation of Budget 2012 savings through its financial management and monitoring processes.
In the third quarter, the Department continued to focus on decreasing the costs of internal operations. Several internal operational changes continued to be implemented in order to deliver efficient, effective and accountable programs for Aboriginal people and Northerners.
AANDC's Implementation Committee, chaired by the Associate Deputy Minister and comprising the Assistant Deputy Ministers and direct reports to the Deputy Minister, continued to provide overall direction, coordination and oversight to all departmental deficit reduction savings implementation activities. The Workforce Management Board also continued to provide oversight on workforce management mechanisms and to ensure consistency and fairness in human resource decisions across the department.
6. Approval by Senior Officials
Approved, as required by the Treasury Board Policy on Financial Resource Management, Information and Reporting:
Deputy Minister
Chief Financial Officer
| Fiscal year 2012-2013 | Fiscal year 2011-2012 | ||||||
|---|---|---|---|---|---|---|---|
| Vote | Expenditures | Total available for use for the year ending March 31, 2013 * | Expended during the quarter ended December 31, 2012 | Year to date used at quarter-end | Total available for use for the year ending March 31, 2012 ** | Expended during the quarter ended December 31, 2011 ** | Year to date used at quarter-end ** |
|
Figures may not add due to rounding
* Includes only Authorities available for use and granted by Parliament at quarter-end. ** Pursuant to section 31.1 of the Financial Administration Act and Order-in-Council P.C. 2011-1297 effective November 15, 2011, $9,606 thousand is deemed to have been appropriated to Shared Services Canada Operating Vote, which results in a reduction for the same amount in Aboriginal Affairs and Northern Development Canada, Vote 1, Appropriation Act No. 1, 2011-2012. Footnote: Pursuant to s. 31.1 of the Financial Administration Act and Order in Council P.C. 2012-286 effective April 1, 2012, $39,481 thousand is deemed to have been appropriated to Indian Affairs and Northern Development Votes 1 ($780K) and 10 ($38,701K), which results in a reduction in the Canadian Heritage Votes 1 and 5 Appropriation Act No. 1, 2012-13. |
|||||||
| 1 | Operating Expenditures | 1,464,755 | 354,929 | 835,401 | 1,378,811 | 316,267 | 861,626 |
| 5 | Capital Expenditures | 22,973 | 5,948 | 6,763 | 14,770 | 406 | 9978 |
| 10 | Grants and contributions | 6,785,068 | 1,707,855 | 4,571,199 | 6,320,002 | 1,479,785 | 4,371,240 |
| (S) | Budgetary statutory authorities - Operating Expenditures: | ||||||
| Contributions to employee benefit plans | 65,049 | 16,262 | 48,787 | 71,154 | 18,392 | 54,920 | |
| Minister of Aboriginal Affairs and Northern Development – Salary and motor car allowance | 78 | 20 | 58 | 78 | 19 | 58 | |
| Payments to comprehensive claim beneficiaries in compensation for resource royalties | 2,591 | 68 | 3,444 | 2,575 | 46 | 631 | |
| Liabilities in respect of loan guarantees made to Indians for Housing and Economic Development | 2,000 | 0 | 6 | 2,000 | 0 | 0 | |
| Grassy Narrows and Islington Bands Mercury Disability Board | 15 | 0 | 0 | 15 | 0 | 0 | |
| Other | - | 3,797 | 5,143 | - | - | - | |
| (S) | Budgetary statutory authorities - Transfer Payments: | ||||||
| Grants to Aboriginal organizations designated to receive claim settlement payments pursuant to Comprehensive Land Claim Settlement Acts | 75,576 | 4,055 | 57,624 | 90,416 | 4,055 | 65,430 | |
| Grant to the Nunatsiavut Government for the implementation of the Labrador Inuit Land Claims Agreement pursuant to the Labrador Inuit Land Claims Agreement Act | 17,987 | 27,343 | 27,343 | 17,987 | 36,715 | 36,715 | |
| Indian Annuities Treaty payments | 1,400 | 37 | 1,874 | 1,400 | (6) | 1,959 | |
| Total Budgetary Authorities | 8,437,491 | 2,120,313 | 5,557,641 | 7,899,208 | 1,855,679 | 5,393,578 | |
| Non-Budgetary Authorities: | |||||||
| Loans to native claimants | 47,403 | 5,973 | 40,657 | 47,403 | 12,781 | 17,750 | |
| Loans to First Nations in British Columbia for the purpose of supporting their participation in the British Columbia Treaty Commission Process | 31,200 | 7,461 | 17,077 | 30,400 | 1,461 | 13,240 | |
| Total Non-Budgetary Authorities | 78,603 | 13,434 | 57,734 | 77,803 | 14,242 | 30,990 | |
| Total Authorities | 8,516,094 | 2,133,747 | 5,615,375 | 7,977,011 | 1,869,920 | 5,424,568 | |
| Fiscal year 2012-2013 | Fiscal year 2011-2012 | ||||||
|---|---|---|---|---|---|---|---|
| # | Expenditures | Planned expenditures for the year ending March 31, 2013 | Expended during the quarter ended December 31, 2012 | Year to date used at quarter-end | Planned expenditures for the year ending March 31, 2012 ** | Expended during the quarter ended December 31, 2011 ** | Year to date used at quarter-end ** |
|
Figures may not add due to rounding ** Pursuant to section 31.1 of the Financial Administration Act and Order-in-Council P.C. 2011-1297 effective November 15, 2011, $9,606 thousand is deemed to have been appropriated to Shared Services Canada Operating Vote, which results in a reduction for the same amount in Aboriginal Affairs and Northern Development Canada, Vote 1, Appropriation Act No. 1, 2011-2012. |
|||||||
| 1 | Personnel | 482,155 | 121,409 | 361,588 | 520,875 | 126,862 | 398,077 |
| 2 | Transportation and communications | 60,359 | 7,742 | 19,709 | 64,216 | 10,559 | 25,130 |
| 3 | Information | 14,009 | 2,507 | 7,963 | 18,047 | 2,710 | 5,291 |
| 4 | Professional and special services | 352,633 | 56,933 | 110,331 | 337,564 | 66,781 | 143,362 |
| 5 | Rentals | 13,332 | 1,876 | 6,209 | 15,129 | 2,930 | 6,754 |
| 6 | Purchased repair and maintenance | 7,327 | 549 | 929 | 6,269 | 600 | 1,636 |
| 7 | Utilities, materials and supplies | 11,252 | 1,046 | 2,748 | 11,152 | 1,387 | 3,357 |
| 8 | Acquisition of land, buidlings and works | 17,114 | 5,078 | 5,078 | 14,977 | 171 | 174 |
| 9 | Acquisition of machinery and equipment | 20,000 | 1,392 | 3,172 | 19,062 | 1,807 | 4,263 |
| 10 | Transfer Payments | 6,880,031 | 1,737,205 | 4,653,668 | 6,429,805 | 1,520,520 | 4,475,317 |
| 12 | Other subsidies and payments | 580,040 | 184,576 | 386,246 | 432,113 | 121,352 | 329,596 |
| Total gross budgetary expenditures | 8,438,253 | 2,120,313 | 5,557,641 | 7,899,208 | 1,855,679 | 5,393,578 | |
| Less: Revenues netted against expenditures: | (762) | ||||||
| Total Revenues netted against expenditures | (762) | 0 | 0 | 0 | 0 | 0 | |
| Total net budgetary expenditures | 8,437,491 | 2,120,313 | 5,557,641 | 7,899,208 | 1,855,679 | 5,393,578 | |