Archived - 2012-2013 Financial Overview – December 2012
Archived information
This Web page has been archived on the Web. Archived information is provided for reference, research or record keeping purposes. It is not subject to the Government of Canada Web Standards and has not been altered or updated since it was archived. Please contact us to request a format other than those available.
PowerPoint Format (1.64 Mb, 19 Pages)
PDF Format (772 Kb, 19 Pages)
This overview does not reflect Budget 2012 announcements.
Table of Contents
- Major Cost Drivers
- Fiscal Cycle
- Minister's Portfolio ($7.8 billion in the 2012–13 Main Estimates)
- Key Area Breakdown
- Departmental Finances
- Program Activity Architecture
- Expenditure Trend – Education
- Expenditure Trend – Social Development
- Expenditure Trend – Community Infrastructure
- Expenditure Trend – Claims
- Program Delivery at AANDC
- Program Delivery – Demographic Realities
- Program Delivery – Geographic Realities (Small Communities)
- Program Delivery – Geographic Realities (Dispersed Communities)
- Program Delivery – Socio-Economic Realities
- Operating Environment – Departmental Accountability for Spending
- Operating Environment – Accountability of Funding Recipients
- In Summary
Major Cost Drivers
Existing Federal Obligations
- Federal obligations in treaties and law (e.g. Constitution Act, 1867 and Indian Act); and major court interpretations (e.g. Guerin, Sparrow, Marshall, McIvor).
- Settlement of outstanding litigation (e.g. residential schools).
Demographic and Inflationary Pressures
- Young, growing and highly dispersed Aboriginal population.
- Price and population have grown by about four per cent annually versus two per cent growth cap.
Policy Commitments
- To resolve and accelerate claims settlements; to provide comparable services to First Nations; to foster independence (e.g. self-government, self-sufficiency); to improve education outcomes; to facilitate opportunities for economic development.
- Environmental and resource management requirements - particularly in the North.
- Economic growth and stability.
Claims, Treaties and Rights
- Growing awareness and recognition of Aboriginal and treaty rights.
Devolution Issues
- Diseconomies of scale - community size and remoteness will impact cost of program delivery.
- Capacity at the community level to deliver programs effectively and efficiently.
Fiscal Cycle
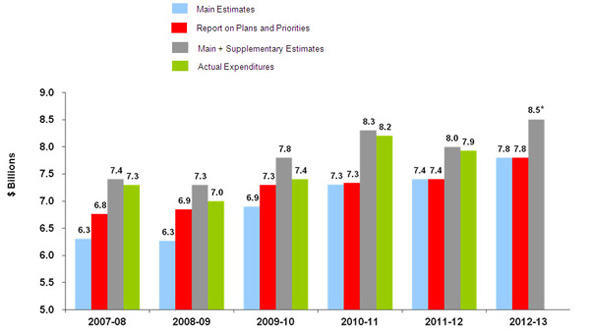
Note: Includes Supplementary Estimates (A) and (B)
Description of figure: Fiscal Cycle
This is an image of a bar graph showing the dollar amounts in the annual estimates cycle for the department including the dollar amounts for the Main Estimates, Report on Plans and Priorities, Main and Supplementary Estimates and the actual expenditures for the fiscal years of 2007–08, 2008–09, 2009–10, 2010–11, 2011–12 and 2012–13. The dollar amounts for the actual expenses for fiscal year 2012–13 are not included.
For 2007–2008 the figures are: $6.3 billion, Main Estimates; $6.8 billion, Report on Plans and Priorities; $7.4 billion, Main and Supplementary Estimates; $7.3 billion, Actual Expenses.
For 2008–2009 the figures are: $6.3 billion, Main Estimates; $6.9 billion, Report on Plans and Priorities; $7.3 billion, Main and Supplementary Estimates; $7.0 billion, Actual Expenses.
For 2009–2010 the figures are: $6.9 billion, Main Estimates; $7.3 billion, Report on Plans and Priorities; $7.8 billion, Main and Supplementary Estimates; $7.4 billion, Actual Expenses.
For 2010–2011 the figures are: $7.3 billion, Main Estimates; $7.3 billion, Report on Plans and Priorities; $8.3 billion, Main and Supplementary Estimates; $8.2 billion, Actual Expenses.
For 2011–2012 the figures are: $7.4 billion, Main Estimates; $7.4 billion, Report on Plans and Priorities; $8.0 billion, Main and Supplementary Estimates; $7.9 billion, Actual Expenses.
For 2012–2013 the figures are: $7.8 billion, Main Estimates; $7.8 billion, Report on Plans and Priorities; $8.5 billion, Main and Supplementary Estimates A and B.
Minister's Portfolio ($7.8 billion in the 2012–13 Main Estimates)
Aboriginal Affairs and Northern Development Canada ($7,796.9 million) supports Aboriginal people (First Nations, Inuit and Metis) and Northerners in their efforts to improve social well-being and economic prosperity; develop healthier, more sustainable communities; and participate more fully in Canada's political, social and economic development to the benefit of all Canadians.
Indian Residential Schools Truth and Reconciliation Commission ($7.7 million) has a mandate to learn the truth and to inform all Canadians about what happened in the residential schools.
Registry of the Specific Claims Tribunal ($2.8 million) facilitates timely access to the Specific Claims Tribunal through client service, quality of advice, efficient and timely processing and unbiased service delivery; ensures the smooth and efficient functioning of hearings; promotes awareness and understanding of the Specific Claims Tribunal Act and related rules and procedures; safeguards the independence of the Specific Claims Tribunal by placing them at arm's length from the Government of Canada.
Canadian Polar Commission ($1.3 million) monitors polar knowledge in Canada and around the world; works with Canadian and international institutions to determine scientific and other priorities; encourages support for Canadian polar research information to Canadians and fosters international co-operation in the advancement of polar knowledge.
First Nations Statistical Institute ($5.0 million) provides First Nations and other stakeholders with timely, accurate, relevant, on-target and properly interpreted statistical information that supports program and policy development decisions and fiscal transfers relating to First Nations.
Key Area Breakdown
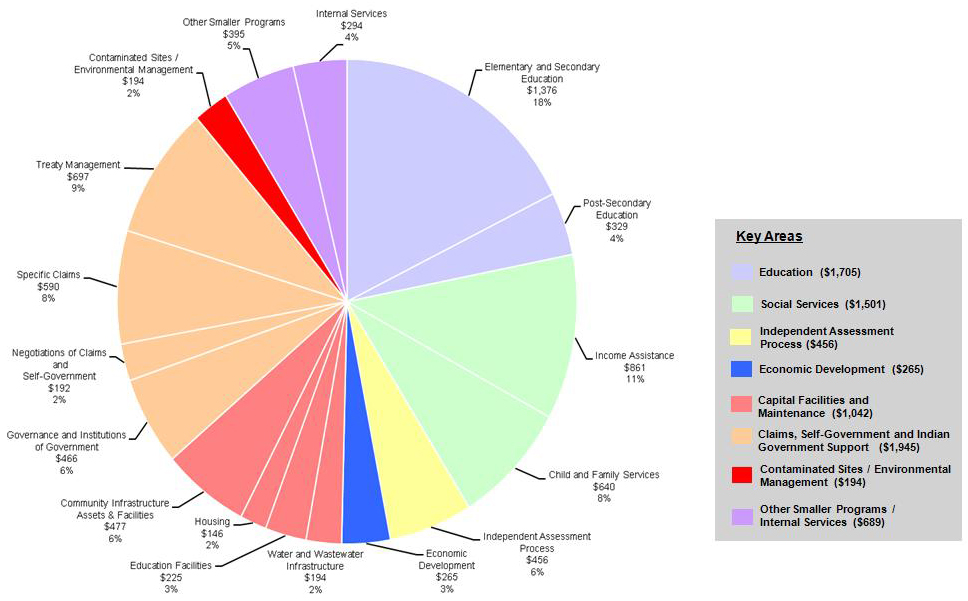
2012–13 Main Estimates - Total $7,797 million
$7,108M is budgeted in 7 key areas on 15 major programs
(each more than $100 million)
(millions of dollars)
Source: 2012–13 Main Estimates
Figures may not add due to rounding
Description of – Key Area Breakdown
This image is of a pie chart showing the breakdown of departmental expenditures for 2012-13, categorized by investments of $7,108 million in 15 major programs which are grouped into 7 key areas: education ($1,705 million) ; social services ($1,501 million); independent assessment process ($456 million); economic development ($265 million); capital facilities and maintenance ($1,042 million); claims, self-government and Indian government support ($1,945 million); and contaminated sites/environmental management ($194 million). The remaining $689 million is spent on smaller programs and Internal Services.
Spending for education includes: $1,376 million for elementary and secondary education (18%) and $329 million for post-secondary education (4%).
Spending for social services includes: $861 million for income assistance (11%) and $640 million for child and family services (8%).
Spending for independent assessment process totals $456 million (6%).
Spending for economic development totals $265 million (3%).
Spending for capital facilities and maintenance includes: $194 million for water and wastewater infrastructure (2%), $225 million for education facilities (3%), $146 million for housing (2%) and $477 million for community infrastructure, assets and facilities (6%).
Spending for claims, self-government and Indian government support includes: $466 million for governance and institutions of government (6%), $192 million for negotiations of claims and self-government (2%), $590 million for specific claims (8%) and $697 million for treaty management (9%).
Spending for contaminated sites/environmental management totals $194 million (2%).
Spending for other smaller programs totals $395 million (5%).
Spending for internal services totals $294 million (4%).
Departmental Finances
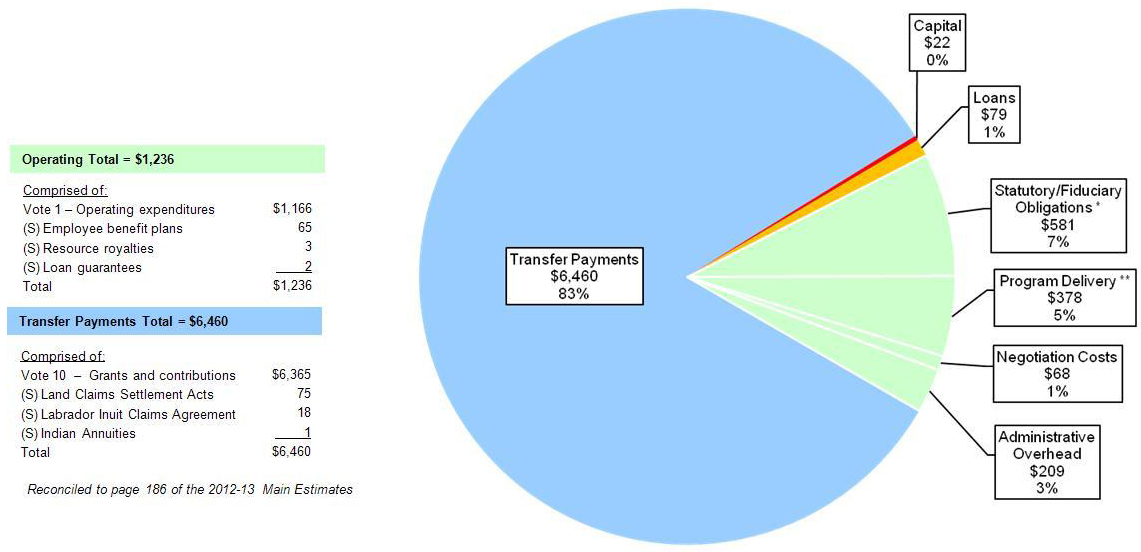
2012–13 Main Estimates - Total $7,797 million
(millions of dollars)
Description of figure: Departmental Finances
This image is of a pie chart showing the breakdown of departmental expenditures for 2012-13. The breakdown is shown as follows: $6,460 million (83%) transfer payments; $79 million (1%) loans; $22 million (0%) capital; $581 million (7%) statutory/fiduciary obligations; $378 million (5%) program delivery; $68 million (1%) negotiation costs; $209 million (3%) administrative overhead.
Of the $581 million for statutory/fiduciary obligations, about $465 million is for direct payments to recipients including: $380 million for obligations pursuant to the Indian Residential Schools Settlement Agreement; and, the remaining $85 million for claims related obligations, Department of Justice costs, out-of-court settlements, etc.
Program delivery costs directly benefit First Nation and northern communities and include costs associated with education, social development, capital/ infrastructure, economic development, Indian government support, environmental initiatives and northern programming. Of the $378 million, about $135 million is for direct payments to recipients, primarily related to the assessment, management and remediation of federal contaminated sites.
This image also contains two tables; the first demonstrates the breakdown of forecasted operating expenses – which total $1,236 million – as follows: $1,166 million for operating expenditures (Vote 1); and the following statutory expenses: $65 million for employee benefit plans; $3 million for resource royalties and $2 million for loan guarantees. The second table demonstrates the breakdown of transfer payments – which total $6,460 million – as follows: $6,365 million for grants and contributions (Vote 10); and the following statutory expenses: $75 million for land claims settlement acts, $18 million for the Labrador Inuit Claims Agreement and $1 million for Indian annuities.
The source for the information for the chart is the 2012-13 Main Estimates. Figures may not add due to rounding.
* Of the $581 million for statutory/fiduciary obligations, about $465 million is for direct payments to recipients including: $380 million for obligations pursuant to the Indian Residential Schools Settlement Agreement; and, the remaining $85 million for claims related obligations, Department of Justice costs, out-of-court settlements, etc.
** Program delivery costs directly benefit First Nation and northern communities and include costs associated with education, social development, capital/infrastructure, economic development, Indian government support, environmental initiatives and northern programming. Of the $378 million, about $135 million is for direct payments to recipients, primarily related to the assessment, management and remediation of federal contaminated sites.
Figures may not add due to rounding.
Program Activity Architecture
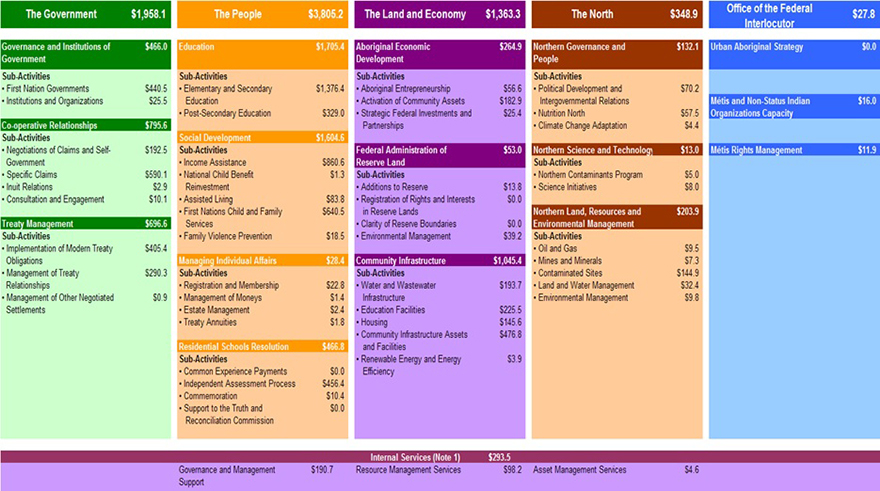
2012–13 Main Estimates - $7,797 million
(millions of dollars)
Note 1: Internal Services are comprised of $209.4 million for Administrative Overhead and $84.1 million for Litigation Support.
Source: 2012–13 Main Estimates; additional details at sub-activity level extracted from departmental budget allocations.
Figures may not add due to rounding and do not reflect Budget 2012 announcements.
Description of – This image of the 2012-2013 Program Activity Architecture breaks down the departmental 2012-2013 planned spending of $7,797 million by strategic outcome, program activity and sub-activity as follows:
The program activity Governance and Institutions of Government: $466 million
- The sub-activity First Nation Governments: $440.5 million
- The sub-activity Institutions and Organizations: $25.5 million
The program activity Co-operative Relationships: $795.6 million
- The sub-activity Negotiations of Claims and Self-Government: $192.5 million
- The sub-activity Specific Claims: $590.1 million
- The sub-activity Inuit Relations: $2.9 million
- The sub-activity Consultation and Engagement: $10.1 million
The program activity Treaty Management: $696.6 million
- The sub-activity Implementation of Modern Treaty Obligations: $405.4 million
- The sub-activity Management of Treaty Relationships: $290.3 million
- The sub-activity Management of Other Negotiated Settlements: $0.9 million
The program activity Education: $1,705.4 million
- The sub-activity Elementary and Secondary Education: $1,376.4 million
- The sub-activity Post-Secondary Education: $329.0 million
The program activity Social Development: $1,604.6 million
- The sub-activity Income Assistance: $860.6 million
- The sub-activity National Child Benefit Reinvestment: $1.3 million
- The sub-activity Assisted Living: $83.8 million
- The sub-activity First Nations Child and Family Services: $640.5 million
- The sub-activity Family Violence Prevention: $18.5 million
The program activity Managing Individual Affairs: $28.4 million
- The sub-activity Registration and Membership: $22.8 million
- The sub-activity Management of Moneys: $1.4 million
- The sub-activity Estate Management: $2.4 million
- The sub-activity Treaty Annuities: $1.8 million
The program activity Residential Schools Resolution: $466.8 million
- The sub-activity Common Experience Payments: $0.0 million
- The sub-activity Independent Assessment Process: $456.4 million
- The sub-activity Commemoration: $10.4 million
- The sub-activity Support to the Truth and Reconciliation Commission: $0.0 million
The program activity Aboriginal Economic Development: $264.9 million
- The sub-activity Aboriginal Entrepreneurship: $56.6 million
- The sub-activity Activation of Community Assets: $182.9 million
- The sub-activity Strategic Federal Investments and Partnerships: $25.4 million
The program activity Federal Administration of Reserve Land: $53.0 million
- The sub-activity Additions to Reserve: $13.8 million
- The sub-activity Registration of Rights and Interests in Reserve Lands: $0.0 million
- The sub-activity Clarity of Reserve Boundaries: $0.0 million
- The sub-activity Environmental Management: $39.2 million
The program activity Community Infrastructure: $1,045.4 million
- The sub-activity Water and Wastewater Infrastructure: $193.7 million
- The sub-activity Education Facilities: $225.5 million
- The sub-activity Housing: $145.6 million
- The sub-activity Community Infrastructure Assets and Facilities: $476.8 million
- The sub-activity Renewable Energy and Energy Efficiency: $3.9 million
The program activity Northern Governance and People: $132.1 million
- The sub-activity Political Development and Intergovernmental Relations: $70.2 million
- The sub-activity Nutrition North: $57.5 million
- The sub-activity Climate Change Adaptation: $4.4 million
The program activity Northern Science and Technology: $13.0 million
- The sub-activity Northern Contaminants Program: $5.0 million
- The sub-activity Science Initiatives: $8.0 million
The program activity Northern Land, Resources and Environmental Management: $203.9 million
- The sub-activity Oil and Gas: $9.5 million
- The sub-activity Mines and Minerals: $7.3 million
- The sub-activity Contaminated Sites: $144.9 million
- The sub-activity Land and Water Management: $32.4 million
- The sub-activity Environmental Management: $9.8 million
The program activity Urban Aboriginal Strategy: $0.0 million
The program activity Métis and Non-Status Indian Organizations Capacity: $16.0 million
The program activity Métis Rights Management: $11.9 million
- The sub-activity Governance and Management Support: $190.7 million
- The sub-activity Resource Management Services: $98.2 million
- The sub-activity Asset Management Services: $4.6 million
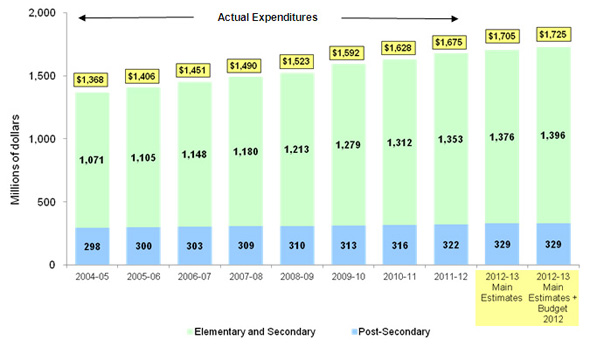
Expenditure Trend – Education
Overall, actual expenditures for education have increased by about 19% over the period 2004–05 to 2010–11 (or by about 2.9% annually).
Source: 2004–05 to 2010–11 as per Departmental Performance Reports (restated); 2011–12 as per Main Estimates (restated) and 2012–13 as per Main Estimates.
Note – To be consistent with figures displayed for 2012–13, figures for 2004–05 through 2011–12 have been restated to reflect the transfer of funding for Education Agreements to the Treaty Management Program Activity (as per the revised Program Activity Architecture for 2011–12) and the consolidation of Cultural Education Centres and First Nations and Inuit Youth Employment Strategy in Elementary and Secondary Education (as per the revised Program Activity Architecture for 2012–13). In addition, an adjustment has also been made to the DPR figures for the period 2004–05 through 2008–09 to provide consistency with the display of Internal Services as a separate program activity beginning in 2009–10 (ie. Internal Services was previously attributed across all program activities).
Figures may not add due to rounding.
Description of – Expenditure Trend – Education
This is an image of a bar graph showing the expenditures made annually by the department for education, broken down for each year into expenditures for elementary and secondary education, and for post-secondary education, from fiscal years 2004–05 to 2012–13. These amounts are based on actual budgetary expenditures (2004–05 to 2011–12), and for 2012–13 two bar graphs are depicted – the first with Main Estimates, and the second with Main Estimates plus Budget 2012.
For 2004–05 a total of $1,368 million was spent on education, with $1,071 million spent for elementary and secondary education and $298 million for post-secondary education.
For 2005–06 a total of $1,406 million was spent on education, with $1,105 million spent for elementary and secondary education and $300 million for post-secondary education.
For 2006–07 a total of $1,451 million was spent on education, with $1,148 million spent for elementary and secondary education and $303 million for post-secondary education.
For 2007–08 a total of $1,490 million was spent on education, with $1,180 million spent for elementary and secondary education and $309 million for post-secondary education.
For 2008–09 a total of $1,523 million was spent on education, with $1,213 million spent for elementary and secondary education and $310 million for post-secondary education.
For 2009–10 a total of $1,592 million was spent on education, with $1,279 million spent for elementary and secondary education and $313 million for post-secondary education.
For 2010–11 a total of $1,628 million was spent on education, with $1,312 million spent for elementary and secondary education and $316 million for post-secondary education.
For 2011–12 a total of $1,675 million was spent on education, with $1,353 million spent for elementary and secondary education and $316 million for post-secondary education.
For 2012–13, the Main Estimates indicate a total of $1,705 million will be spent on education, with $1,376 million spent for elementary and secondary education and $329 million for post-secondary education.
For 2012–13, the Main Estimates and an adjustment of $20 million from Budget 2012 indicate a total of $1,725 million will be spent on education, with $1,396 million spent for elementary and secondary education and $329 million for post-secondary education.
Overall, actual expenditures for education have increased by about 22 per cent over the period 2004–05 to 2011–12 (or by about 2.9 per cent annually).
Expenditure Trend – Social Development
Overall, actual expenditures for social development have increased by about 32% over the period 2004–05 to 2010–11 (or by about 4.7% annually).
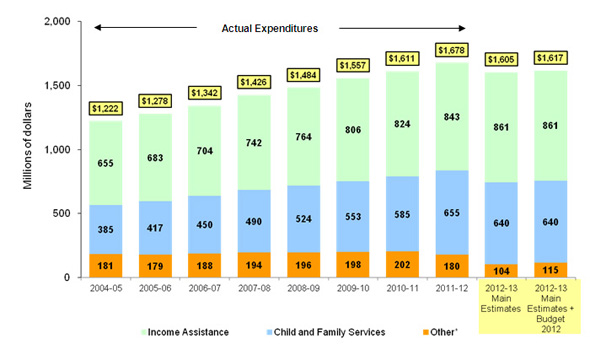
Description of figure: Expenditure Trend – Social Development
This is an image of a bar graph showing the expenditures made annually by the department for social development, broken down for each year into expenditures for income assistance, child and family services, and other, from fiscal years 2004–05 to 2012–13. The "other" category includes other social development programs and initiatives: assisted living, family violence prevention, national child benefit re-investment and family capacity initiatives. These amounts are based on actual budgetary expenditures (2004–05 to 2011–12), and for 2012–13 two bar graphs are depicted – the first with Main Estimates, and the second with Main Estimates plus Budget 2012.
For 2004–05 a total of $1,222 million was spent on social development, with $655 million spent on income assistance, $385 million for child and family services, and $181 million for other social development programs and initiatives.
For 2005–06 a total of $1,278 million was spent on social development, with $683 million spent on income assistance, $417 million for child and family services, and $179 million for other social development programs and initiatives.
For 2006–07 a total of $1,342 million was spent on social development, with $704 million spent on income assistance, $450 million for child and family services, and $188 million for other social development programs and initiatives.
For 2007–08 a total of $1,426 million was spent on social development, with $742 million spent on income assistance, $490 million for child and family services, and $194 million for other social development programs and initiatives.
For 2008–09 a total of $1,484 million was spent on social development, with $764 million spent on income assistance, $524 million for child and family services, and $196 million for other social development programs and initiatives.
For 2009–10 a total of $1,557 million was spent on social development, with $806 million spent on income assistance, $553 million for child and family services, and $198 million for other social development programs and initiatives.
For 2010–11 a total of $1,611 million was spent on social development, with $824 million spent on income assistance, $585 million for child and family services, and $202 million for other social development programs and initiatives.
For 2011–12 a total of $1,678 million was spent on social development, with $843 million spent on income assistance, $655 million for child and family services, and $180 million for other social development programs and initiatives.
For 2012–13, the Main Estimates indicate a total of $1,605 million will be spent on social development, with $861 million spent on income assistance, $640 million for child and family services, and $115 million for other social development programs and initiatives.
For 2012–13, the Main Estimates and an adjustment $12 million from Budget 2012 indicate a total of $1,617 million will be spent on social development, with $861 million spent on income assistance, $640 million for child and family services, and $115 million for other social development programs and initiatives.
Overall, actual expenditures for social development have increased by about 37 per cent over the period 2004–05 to 2011–12 (or by about 4.6 per cent annually).
* Other includes Assisted Living, Family Violence Prevention, National Child Benefit Re-investment and Family Capacity Initiatives.
Source: 2004–05 to 2010–11 totals as per Departmental Performance Reports; 2011–12 and 2012–13 as per Main Estimates; to be consistent with figures displayed for 2009–10 to 2012–13, figures for prior years have been restated to remove Internal Services which was previously attributed to program activities.
Figures may not add due to rounding.
Expenditure Trend – Community Infrastructure
Overall, actual expenditures for community infrastructure have increased by about 36% over the period 2004–05 to 2010–11.
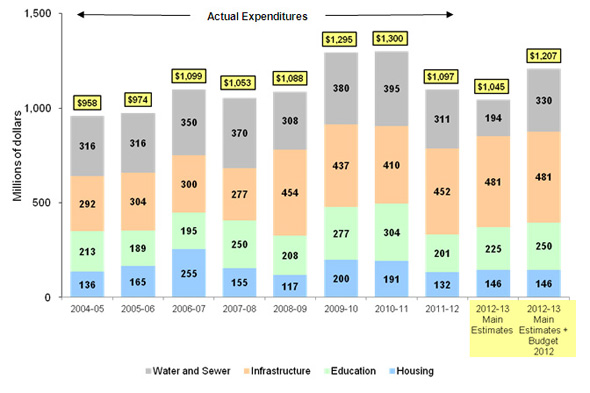
Description of figure: Expenditure Trend – Community Infrastructure
This is an image of a bar graph showing the expenditures made annually by the department for community infrastructure, broken down for each year into expenditures for water and sewage, infrastructure, education, and housing, from fiscal years 2004–05 to 2012–13. These amounts are based on actual budgetary expenditures (2004–05 to 2011–12), and for 2012–13 two bar graphs are depicted – the first with Main Estimates, and the second with Main Estimates plus Budget 2012.
For 2004–05 a total of $958 million was spent on community infrastructure, with $316 million spent on water and sewage infrastructure, $292 million for infrastructure, $213 million for education infrastructure, and $136 million for housing infrastructure.
For 2005–06 a total of $974 million was spent on community infrastructure, with $316 million spent on water and sewage infrastructure, $304 million for infrastructure, $189 million for education infrastructure, and $165 million for housing infrastructure.
For 2006–07 a total of $1,099 million was spent on community infrastructure, with $350 million spent on water and sewage infrastructure, $300 million for infrastructure, $195 million for education infrastructure, and $255 million for housing infrastructure.
For 2007–08 a total of $1,053 million was spent on community infrastructure, with $370 million spent on water and sewage infrastructure, $277 million for infrastructure, $250 million for education infrastructure, and $155 million for housing infrastructure.
For 2008–09 a total of $1,088 million was spent on community infrastructure, with $308 million spent on water and sewage infrastructure, $454 million for infrastructure, $208 million for education infrastructure, and $117 million for housing infrastructure.
For 2009–10 a total of $1,295 million was spent on community infrastructure, with $380 million spent on water and sewage infrastructure, $437 million for infrastructure, $277 million for education infrastructure, and $200 million for housing infrastructure.
For 2010–11 a total of $1,300 million was spent on community infrastructure, with $395 million spent on water and sewage infrastructure, $410 million for infrastructure, $304 million for education infrastructure, and $191 million for housing infrastructure.
For 2011–12 a total of $1,0970 million was spent on community infrastructure, with $311 million spent on water and sewage infrastructure, $452 million for infrastructure, $201 million for education infrastructure, and $132 million for housing infrastructure.
For 2012–13, the Main Estimates indicate a total of $1,045 million will be spent on community infrastructure, with $194 million spent on water and sewage infrastructure, $481 million for infrastructure, $225 million for education infrastructure, and $146 million for housing infrastructure.
For 2012–13, the Main Estimates and an adjustment of $162 million from Budget 2012 indicate a total of $1,207 million will be spent on community infrastructure, with $330 million spent on water and sewage infrastructure, $481 million for infrastructure, $250 million for education infrastructure, and $146 million for housing infrastructure.
Overall, actual expenditures for community infrastructure have averaged about $1.1 billion annually over the period 2004–05 to 2011–12.
Source: 2004–05 to 2010–11 totals as per Departmental Performance Reports (restated); 2011–12 and 2012–13 as per Main Estimates; additional detailed information extracted from the Long-Term Capital Plan; to be consistent with figures displayed for 2009–10 to 2012–13, figures for prior years have been restated to remove Internal Services and capital and O&M funding for the James Bay Crees, the Ouje-Bougoumou Crees and the Naskapi bands of Quebec.
Figures may not add due to rounding.
Expenditure Trend – Claims
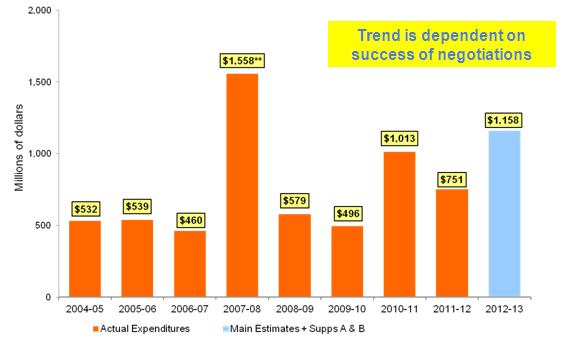
* Includes funding for negotiation, settlement and implementation of claims; excludes non-budgetary (loan) funding.
** Reflects $1.1 billion one-time payment to the Cree of Quebec for matters arising from the implementation of the James Bay and Northern Quebec Agreement.
Description of Expenditure Trend – Claims
This is an image of a bar graph showing the expenditures made annually by the department for the negotiation, settlement and implementation of claims, from fiscal years 2004–05 to 2012–13. The amounts in this bar graph are based on actual budgetary expenditures (2004–05 to 2011–12) and Main Estimates plus Supplementary Estimates A and B (2012–13).
The figures are as follows: $532 million (2004–05), $539 million (2005–06); $460 million (2006–07); $1,558 million (2007–08); $579 million (2008–09); $496 million (2009–10); $1,013 million (2010–11); $751 million (2011–12); $1,158 million (2012–13).
Program Delivery at AANDC
Highly Decentralized with 10 Regions
South of 60°
- About 80 per cent of resources are used to fund programs delivered by First Nations community governments, Tribal Councils, etc.
- Most funds are for basic provincial/municipal type services to individuals on reserve.
- The federal government is committed to providing services on reserves comparable to those typically provided by the provinces.
- Provincial standards guide program delivery leading to variability across regions.
North of 60°
- Within the federal government, the Minister has the lead responsibility for the North, including the Northern Strategy.
- The department has a province-like role in water and oil and gas management.
- AANDC manages land and resources in Nunavut and the Northwest Territories (Yukon is devolved).
Program Delivery – Demographic Realities
- According to the 2006 Census of Population, there are 1,172,785 Aboriginal individuals in Canada, representing 3.8% of the total Canadian population.
- Registered Indians account for over half of the Aboriginal population.
- In 2006, almost half (47.8%) of Aboriginal people were less than 25 years of age compared with almost one-third (30.7%) of non-Aboriginal people.
- The median age for Aboriginal people is 27 years, 13 years less than for non-Aboriginals (40 years).
- The total population of the territories is approximately 101,000 – slightly over half are Aboriginal.
* Other refers to individuals who reported more than one Aboriginal group, and those who reported being a Band member with no Aboriginal identity and no Registered Indian status.
Source: 2006 Census of Population, AANDC tabulations. Data from the 2011 Census will be available in early 2013.
Description of – Program Delivery – Demographic Realities
This is an image of a pie chart showing the distribution of the Aboriginal population by registration status and identity as of 2006. The chart indicates that: 53.2% self-identified as registered Indians; 30.3% as Métis; 11.4% non-status Indians; 4.2% Inuit and 0.9% as other ("other" refers to individuals who reported more than one Aboriginal group, and those who reported being a Band member with no Aboriginal identity and no registered Indian status). The source for the data in the chart is the 2006 Census of Population with tabulations done by Aboriginal Affairs and Northern Development Canada. Data from the 2011 Census will be available in early 2013.
Program Delivery – Geographic Realities (Small Communities)
- According to the 2006 Census of Population, 75% of First Nations reserves have less than 500 inhabitants; the majority are located in British Columbia.
- First Nations communities include legally defined Indian reserves, Indian settlements, other land types created by the ratification of self-government agreements, and northern communities affiliated with First Nations.
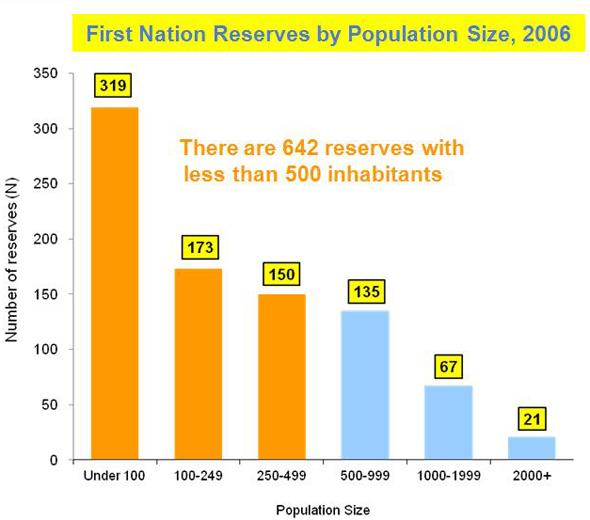
Description of figure: Program Delivery – Geographic Realities (Small Communities)
This image is of a bar chart showing the distribution of the 865 First Nation reserves by population size based on Statistics Canada 2006 information. The chart indicates that 319 reserves have a population of 100 or less; 173 have populations of between 100 and 249; 150 between 250 and 499; 135 between 500 and 999; 67 between 1000 and 1999 and; 21 with populations of more than 2000. There are 642 reserves with less than 500 inhabitants. The source for this data is from AANDC, derived from 2006 Geosuite, Statistics Canada. Data from the 2011 Census will be available in early 2013.
Note: N=865 out of a possible 1,176 First Nation communities delineated by Statistics Canada in 2006. Not included are unpopulated reserves and 22 incompletely enumerated reserves that did not participate in the Census.
Source: AANDC derived from 2006 Geosuite, Statistics Canada. Data from the 2011 Census will be available in early 2013.
Program Delivery – Geographic Realities (Dispersed Communities)
As of 2011, 66% of Registered Indians on reserve lived in rural, special access, or remote zones; 34% lived in urban zones.
Description of figure: Program Delivery – Geographic Realities (Dispersed Communities)
This image is of a pie chart showing the population distribution by percentage of the on-reserve population by geographic zone. The population distribution is as follows: Rural, 44.7%; Urban, 34.3%; Special Access, 17.3% and; Remote, 3.7%. The definitions for these categories are: Urban: the First Nation is located within 50 km of the nearest service centre with a year-round road access. Rural: the First Nation is located between 50 and 350 km from the nearest service centre with a year-round road access. Remote: the First Nation is located over 350 km from the nearest service centre with year-round road access. Special Access: The First Nation has no year-round road access to a service centre and, as a result, experiences a higher cost of transportation. Source: Indian Register Population by Geographic Zone, 2011. This data does not reflect the impact of the Gender Equity in Indian Registration Act (Bill C-3) or the creation of the Qalipu First Nation in Newfoundland.
Note:
Urban: The First Nation is located within 50 km of the nearest service centre with a year-round road access.
Rural: The First Nation is located between 50 and 350 km from the nearest service centre with a year-round road access.
Remote: The First Nation is located over 350 km from the nearest service centre with year-round road access.
Special Access: The First Nation has no year-round road access to a service centre and, as a result, experiences a higher cost of transportation.
Source: Indian Register Population by Geographic Zone, 2011. This data does not reflect the impact of the Gender Equity in Indian Registration Act (Bill C-3) or the creation of the Qalipu First Nation in Newfoundland.
Program Delivery – Socio-Economic Realities
- There has been progress over the last 25 years in improving the socio-economic conditions in First Nations and Inuit communities.
- A significant gap still exists in the socio-economic conditions of First Nations and Inuit communities compared to those of other communities.
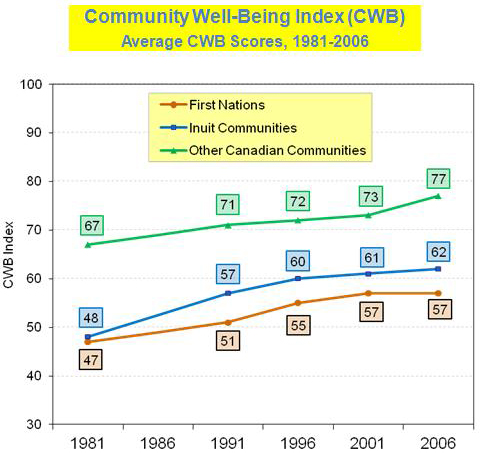
Description of figure: Program Delivery – Socio-Economic Realities
This image is of a line graph showing the average Community Well-Being scores of First Nation, Inuit and other Canadian communities for the years 1981, 1991, 1996, 2001 and 2006. The Community Well-Being Index is a method of assessing general well-being of Canadians at the community level in terms of education, labour force activity, income and housing. The scores are plotted on an XY axis chart where the "X" axis are the years 1981 to 2006 and the "Y" is the Community Well-Being Index scores from 30 to 100. The chart shows that the scores for First Nation communities were: 47 (1981); 51 (1991); 55 (1996); 57 (2001); 57 (2006).
The scores for Inuit communities were: 48 (1981); 57 (1991); 60 (1996); 61 (2001); 62 (2006). The scores for other Canadian communities were: 67 (1981); 71 (1991); 72 (1996); 73 (2001); 77 (2006). The source for the data used in the line is Statistics Canada's Census of Population for 1981, 1991, 1996, 2001, 2006. Data from the 2011 Census will be available in early 2013.
Source: Statistics Canada, 1981, 1991, 1996, 2001 and 2006 Census of Population. Data from the 2011 Census will be available in early 2013.
Operating Environment – Departmental Accountability for Spending
- Each year the department produces a spending plan (the Report on Plans and Priorities) and a performance report (the Departmental Performance Report) as part of the government-wide Estimates and Public Accounts.
- Quarterly financial reports and annual financial statements are published on the department's website.
- All auditable units are audited using a risk-based audit plan. The plan and all audits are posted on the department's website following review by the department's Audit Committee, which is composed of five external experts.
- All spending programs are evaluated for effectiveness and the reports are published on the department's website.
- All contracts (above $10,000) are listed on the department's website.
- External reviews are conducted by the Auditor General and other Officers of Parliament.
Operating Environment – Accountability of Funding Recipients
- In 2011, following an internal audit and evaluation, and discussions with First Nation governments and financial experts, AANDC implemented the Default Prevention and Management Policy (DPMP).
- The DPMP exists to help First Nations improve their financial management and reporting practices and to develop their capacity to be self managing. It focuses on default prevention and provides a more flexible range of remediation strategies to address default situations, including intervention through the development of a management plan, the hiring of external expert resources (co-management), and third-party management.
- Under this policy, AANDC also provides tools to help remedy specific defaults and support longer-term community development (i.e. General Assessment).
- Annual consolidated audited financial statements must be submitted to AANDC and are reviewed, along with other information to ensure the terms and conditions of the funding agreement are being met.
- These financial statements must also be disclosed to the membership of the funding recipient. This is being strengthened by the tabling of the First Nations Financial Transparency Act, which puts these obligations in law and also requires the information to be disclosed to the public at large.
- Funding agreements also include an audit clause to allow AANDC to ensure that funds are used for intended purposes.
- The department is committed to supporting stronger performance management and reporting to ensure that funds are managed with integrity, transparency and accountability while reducing recipients' reporting burden.
In Summary
- AANDC is one of several federal departments delivering programs and services to Aboriginal peoples and Northerners.
- The department's overall funding is increasing due to significant investments made in priority areas and through successive budgets since 2006.
- Spending is impacted by deeply embedded cost drivers such as demographics, inflation, comparability, devolution/self-government, etc.
- Investments are primarily directed at basic services – Education, Social Development, Community Infrastructure.
- The department has a number of measures in place to strengthen financial and performance management.