Archived - Aboriginal Affairs and Northern Development Canada Quarterly Financial Report - For the Quarter Ended September 30, 2012
Archived information
This Web page has been archived on the Web. Archived information is provided for reference, research or record keeping purposes. It is not subject to the Government of Canada Web Standards and has not been altered or updated since it was archived. Please contact us to request a format other than those available.
1. Introduction
This quarterly financial report has been prepared by management as required by section 65.1 of the Financial Administration Act and in the form and manner prescribed by the Treasury Board. It should be read in conjunction with the Main Estimates and Supplementary Estimates (A) for fiscal year 2012-13 as well as Canada's Economic Action Plan 2012 (Budget 2012). For purposes of both the Main and Supplementary Estimates, the Department is referred to as Indian Affairs and Northern Development.
The quarterly financial report has not been subject to an external audit or review.
1.1 Authority, Mandate and Program Activities
Aboriginal Affairs and Northern Development Canada (AANDC) supports Aboriginal people (First Nations, Inuit and Métis) and Northerners in their efforts to:
- Improve social well-being and economic prosperity;
- Develop healthier, more sustainable communities; and
- Participate more fully in Canada's political, social and economic development – to the benefit of all Canadians.
AANDC is one of the federal departments responsible for meeting the Government of Canada's obligations and commitments to First Nations, Inuit and Métis, and for fulfilling the federal government's constitutional responsibilities in the North. AANDC's responsibilities are largely determined by numerous statutes, negotiated agreements and legal decisions.
Most of the Department's program spending is delivered through partnerships with Aboriginal communities and federal-provincial or federal-territorial agreements. AANDC also works with urban Aboriginal persons, Métis and Non-Status Indians (many of whom live in rural areas) through the Office of the Federal Interlocutor.
Further details on AANDC's authority, mandate and program activities can be found in Part II of the Main Estimates and the Report on Plans and Priorities.
1.2 Basis of Presentation
This quarterly report has been prepared by management using an expenditure basis of accounting and a special purpose financial reporting framework designed to meet financial information needs with respect to the use of spending authorities. The accompanying Statement of Authorities includes AANDC's spending authorities granted by Parliament and those used by the Department consistent with the Main Estimates and Supplementary Estimates (A) as well as the Operating Budget Carry Forward and the Capital Budget Carry Forward for the 2012-2013 fiscal year.
The authority of Parliament is required before monies can be spent by the Government. Approvals are given in the form of annually approved limits through appropriation acts or through legislation in the form of statutory spending authority for specific purposes.
As part of the Parliamentary business of supply, the Main Estimates must be tabled in Parliament on or before March 1 preceding the new fiscal year. Budget 2012 was tabled in Parliament on March 29, after the tabling of the Main Estimates on February 28, 2012. As a result the measures announced in the Budget 2012 are not reflected in the 2012-13 Main Estimates.
In fiscal year 2012-2013, frozen allotments will be established by Treasury Board authority in departmental votes to prohibit the spending of funds already identified as savings measures in Budget 2012. In future years, the changes to departmental authorities will be implemented through the Annual Reference Level Update, as approved by Treasury Board, and reflected in the subsequent Main Estimates tabled in Parliament.
The Department uses the full accrual method of accounting to prepare and present its annual departmental financial statements that are part of the departmental performance reporting process. However, the spending authorities voted by Parliament remain on an expenditure basis.
1.3 AANDC's Financial Structure
The parliamentary vote structure of AANDC is made up of $8.0 billion in budgetary authorities of which $7.8 billion requires approval by Parliament; referred to as voted amounts. The remaining $164.7 million represents statutory authorities that do not require additional approval and are provided for information purposes.
Voted amounts totalling $7.8 billion are split between Operating Expenditures, Capital Expenditures and Grants and Contributions as follows:
- Operating Expenditures represents approximately $1.2 billion (15.5%), this includes $439.4 million (5.6%) for the Settlement Allotment (Independent Assessment Process and Alternative Dispute Resolution) and $96.3 million (1.2%) for the Assessment, Management and Remediation of Federal Contaminated Sites
- Capital represents approximately $23.0 million (0.3%)
- Grants and Contributions represent approximately $6.6 billion (84.2%)
More detailed information about AANDC's financial structure, including information about the fiscal cycle, cost drivers, expenditure trends, etc. can be found online.
2. Highlights of Fiscal Quarter and Fiscal Year to Date (YTD) Results
This section highlights the significant items that contributed to the net increase or decrease in resources available for the year and actual expenditures for the quarter ended September 30, 2012. The explanation of variances considers that changes under 5% would have minimal impact on interpretation of results.
2.1 Statement of Authorities (Table 1)
The Quarterly Financial Report reflects the year over year change in authorities for the period from April 1st to September 30th, 2012 and the quarter over quarter change for the period July 1st to September 30th, 2012. Total year-to-date authorities available for use in the second quarter of 2012-13 were $8,035.2 million compared to $7,399.5 million for the same quarter of the prior year, representing an increase in Departmental authorities of $635.7 million. The second quarter increase of $26.2 million over the first quarter in 2012-13 can be explained as follows:
- The Operating Budget Carry Forward which increased in 2012-13 by $25.2M over 2011-12. This increase is attributed to $11.1M in funds carried forward for Federal Contaminated Sites Action Plan projects and $13M in funds related to operational efficiencies achieved by the Department and gains realized through streamlining business operations.
- The Capital Budget Carry Forward of $1.0M. This increase is attributed to $0.3M in funds for the Marshall Strategy - Additions to Reserve $0.7M in funds for the Canadian High Arctic Research Station. The Capital Budget Carry Forward was not available to the Department prior to 2012-13.
The total 2012-13 year-to-date authority increase of $635.7M over 2011-12 can also be explained by the following major items:
| Description | Increase / (Decrease) in Authorities Available For Use ($ millions) |
|||||
|---|---|---|---|---|---|---|
| Operating * | Capital | Grants and Contributions * |
Non-Budgetary | Total | ||
| a. | Funding for negotiation, settlement and implementation of specific and comprehensive claims | (16.5) | 4.3 | 439.1 | 0.8 | 427.7 |
| b. | Funding for the assessment, management and remediation of federal contaminated sites | 96.3 | 41.4 | 137.8 | ||
| c. | Funding to meet increased demand for ongoing Indian and Inuit programs providing access to basic services such as education and social support services | 0.3 | 98.6 | 98.9 | ||
| d. | Funding for awards to claimants resulting from the Independent Assessment Process and Alternative Dispute Resolution related to the Indian Residential Schools Settlement Agreement | 73.3 | (0.6) | 72.7 | ||
| e. | Transfer from Canadian Heritage for the Urban Aboriginal Youth and Community Unit | 0.8 | 38.7 | 39.5 | ||
| f. | Funding to support tripartite education agreements with First Nations in British Columbia and to advance readiness for education comparability in other provinces through the Education Partnerships Program | 23.1 | 23.1 | |||
| g. | Funding to upgrade, repair or replace essential fuel storage tanks in First Nation communities under the Capital Facilities and Maintenance Program | 12.0 | 12.0 | |||
| h. | Funding for legislative and regulatory changes to improve the northern regulatory system and to implement the Cumulative Impact Monitoring Program in the Northwest Territories and Nunavut | 7.6 | 2.6 | 10.2 | ||
| i. | Other various initiatives (net) ** | (2.5) | 5.4 | 13.3 | 16.2 | |
| j. | Sunset of funding for First Nations Water and Wastewater Action Plan | (11.3) | (147.9) | (159.2) | ||
| k. | Decrease reflecting the approved funding for the First Nations Infrastructure Fund | (0.7) | (42.3) | (43.0) | ||
| l. | Decrease reflecting the transfer of funding to Shared Services Canada for information technology services | (26.4) | (26.4) | |||
| m. 1st Qtr. |
Sub-total increase / (decrease) to Departmental Authorities | 120.9 | 9.8 | 478.1 | 0.8 | 609.6 |
| n. | Operating Budget Carry Forward | 25.2 | 25.2 | |||
| o. | Capital Budget Carry Forward | 1.0 | ||||
| p. 2nd Qtr. |
Sub-total increase / (decrease) to Departmental Authorities | 25.2 | 1.0 | 0.0 | 0.0 | 26.2 |
| q = m + p |
Total increase / (decrease) to Departmental Authorities | 146.1 | 10.8 | 478.1 | 0.8 | 635.7 |
* Includes statutory authorities
** e.g. Canada's Clean Air Agenda, Beaufort Regional Environmental Assessment, First Nations Child and Family Services Programs, Northwest Territories land and resources devolution, Canadian High Arctic Research Station and sunset of funding for Urban Aboriginal Strategy and Family Violence Prevention Program
Note: Figures may not add due to rounding
- As shown in the table above, the $635.7M increase in total authorities is primarily attributed to an increase of $146.1M in Operating expenditures and $478.1M in Grants and Contributions.
- The increase of $146.1M in Operating expenditures is primarily due to the renewal of $96.3M in funding for the assessment, management and remediation of federal contaminated sites, a $73.3M increase of funding for the Indian Residential Schools Settlement Agreement and the $25.2M increase in the Operating Budget Carry Forward. The $146.1M increase is partially offset by the transfer of $26.4M in funding to Shared Services Canada for information technology services.
- The increase of $478.1M in Grants and Contributions is primarily due to the $439.1M increase in funding for claims activities, notably for the $307.2M settlement of the Coldwater-Narrows Specific Claim and $98.6M in funding to meet increased demand for ongoing Indian and Inuit programs providing access to basic services such as education and social support services. This increase is partially offset by the sunset of $147.9M in funding for First Nations Water and Wastewater Action Plan which will be renewed through Supplementary Estimates B in the next quarter.
2.2 Statement of Departmental Budgetary Expenditures by Standard Object (Table 2)
Highlights of Fiscal Quarter Ended September 30, 2012
Departmental spending in the second quarter of 2012-13 was $251M lower than the same period in 2011-12. This net decrease of 13.9% can be attributed mainly to decreases of: $188M in transfer payments (standard object 10), $32M in Personnel costs (standard object 1), $23M in Professional and special services costs (standard object 4) and $8M to other costs such as transportation and communication and rentals.
The decrease of $188M in transfer payments is related primarily to the timing of specific claims settlements. In the second quarter of 2011-12 there were two settlement payments totaling $230M, one to the Roseau River Anishnabe First Nation Government for $81M and one to the Fort William First Nation for $149M. During the second quarter of 2012-13 there were no specific claims settlements. The variance of $230M was offset by increases in transfer payments such as $16M for education and $26M due the timing of grant payments to the Governments of Nunavut and the Northwest Territories for hospital and physician services.
The decrease of $32M in Personnel costs can be attributed to reduced expenditures in severance pay costs related to the Immediate Settlement of Civilian severance pay and termination benefits. In the second quarter of 2011-12, there was $33M in expenditures whereas in the second quarter of 2012-13 there was only $1M in expenditures.
Lastly, the decrease of $23M in Professional and special services can be attributed primarily to reduced expenditures in the second quarter of 2012-13 of $16M due to the timing of billings for litigation services from the Department of Justice and $7M in discretionary spending related to other professional and business services.
Highlights of Fiscal Year-to-Date (YTD) Results
Year-to-date total departmental spending resulted in a net decrease of $101M which is attributable to an increase in spending of $150M in the first quarter and an off-setting decrease in spending of $251M in the second quarter. The net decrease in expenditures is primarily due to activities related to the negotiation and settlement of specific claims.
Year-to-Date Comparison of Budgetary Authorities and Expenditures as of the end of September 2012 ($ millions)
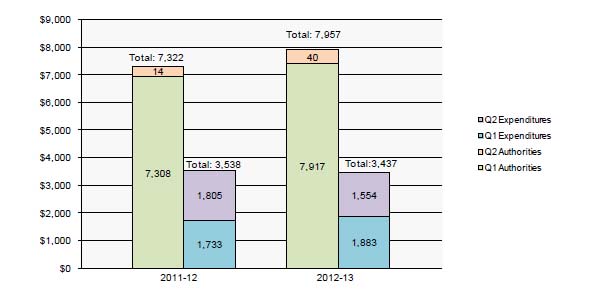
Text Description of Year-to-date Comparison of Budgetary Authorities and Expenditures as of the end of September 30th, 2012
This image is of a bar graph of the year-to-date comparison of budgetary authorities and expenditures as of the end of September 30th, 2012. The graph plots the authorities and expenditures by quarter arriving at a year to date total for the fiscal years 2011-12 and 2012-13.
The 2011-12 data shows the Q2 authorities equaling the Main Estimates, the Supplementary Estimates A authorities, and the Operating Budget Carry Forward arriving at the total authority at the end of Q1 of $7,322M. The 2012-2013 data shows the Q2 authorities equaling the Main Estimates, the Supplementary Estimates A authorities, the Operating Budget Carry Forward and the Capital Budget Carry Forward arriving at the total authority at the end of Q2 of $7,957M.
The net difference in comparing the authorities at the end of Q2 each fiscal year is an increase of $635M from 2011-12 to 2012-13.
The second column of each section of the graph pertains to expenditures. The 2011-12 data shows the Q1 expenditures of $1,733M and the Q2 expenditures of $1,805M arriving at a total of $3,538M. The 2012-13 data shows the Q1 expenditures of $1,883M and the Q2 expenditures of $1,554M arriving at a total of $3,437. The net difference in comparing the expenditures at the end of Q2 each fiscal year is a decrease of $101M from 2011-12 to 2012-13.
3. Risks and Uncertainties
3.1 Risks and Uncertainties
AANDC continues to carry out its mandate in an operating environment that is complex and continually evolving. A key factor in Canada's changing demographic landscape is the growing Aboriginal population, which is young and growing at twice the rate of the overall Canadian population. This growth brings increasing demands for services - Aboriginal people in Canada continue to attain lower levels of education, have poorer health and quality of life, and higher levels of unemployment than the overall Canadian population. The growing Aboriginal population presents an unprecedented opportunity to harness the potential of capable, educated Aboriginal youth to fill crucial labour shortages now and in the future. For this to happen, the Department requires an integrated set of plans, policies and programs to foster and build on the economic advancements resulting from the increasing employment opportunities and wealth that is being created by Aboriginal businesses and communities.
3.2 Risk Mitigating Strategies
As a result of the complexity the Department faces, financial and operating environments are continually changing. As such, risk management and risk-based decision-making have become a critical component in the way Department prioritizes and conducts its business. AANDC is currently in the process of testing its controls at the entity and financial levels. A detailed approach and methodology was developed over the last two quarters with the final analysis expected to be complete by Q4. In addition to control testing, resource allocation decisions across the Department are reviewed and approved by senior management.
The Department conducts an annual assessment of its risks as a part of the AANDC Corporate Risk Profile (CRP). The CRP is a point-in-time overview and assessment of the most significant risks which threaten achievement of the Department's mandate. The CRP was updated in August 2012 and the process included a review of the Department's Risk Register and select program and regional risk profiles and targeted interviews with Director/ Director General level representatives from selected policy, functional and other areas, particularly those areas that have undergone significant and recent change and or areas that play key roles on horizontal files.
After careful and considerable analysis by AANDC's senior and executive management, nine risk categories were included in the CRP. Although these nine categories are slightly modified the previous year's CRP, AANDC's senior and executive management were actively involved in refining the risks, risk drivers and consequences to ensure the current realities of AANDC's internal and external operating environment are well reflected. Each risk has been assigned to risk owner and strategies to mitigate each risk are being developed and integrated into the Corporate Business Plan.
Aboriginal Relationship Risk was the only risk area assessed as "very high" by the Department. While the potential consequences are significant, several mitigation strategies are being proposed for the coming year. Program renovation initiatives (including revamping funding mechanisms), the streamlining of departmental processes as a result of Expenditure Management activities, and the implementation of risk-based approaches on recipient monitoring and reporting should help the Department conduct business more efficiently and effectively. This streamlining will mean less frustration for clients and a reduction in the duplication of effort when trying to access program funding.
Four risk areas were assessed as "high". The proposed mitigation strategies for HR Capacity and Capabilities Risk include the development and implementation of workplace wellness initiatives, implementation of the AANDC Learning and Training Strategy and the developing inter-departmental staff exchanges. Information for Decision making Risk deals with possibility that the Department might not have the information it needs in order to fulfill its obligations. To this end, efforts on reducing and streamlining recipient reporting will continue where possible. This includes plans to work with Health Canada on the integration of key data systems. A strategy on outsourcing data collection is also under development and will be considered. Environmental Risk is the possibility that the Department may not be able to manage environmental issues and liabilities in a timely and cost effective manner. Mitigation strategies for this risk include ongoing support for Northern environmental monitoring programs and the Nunavut General Monitoring Plan. The Department is also proposing additional governance processes for major Northern projects. The Department also plans to pilot Community Land Use Planning which should increase attention on infrastructure and environmental issues in the North. The last assessed as HIGH is Legal Risk. The Litigation Management and Resolution Branch has undertaken a number of activities that has helped the Department better prepare for court decisions, including a proactive Reach Program that informs ADMs about upcoming litigation so that they can better consider the effects on their programs. The Department will also continue to consult regularly with the Department of Justice in order to better comprehend all the aspects on legal issues.
The remaining four risks (Implementation, Government Partnership, External Partnership and Resource Alignment) were assessed as "moderate". While these risks may not have the same likelihood of occurrence of impact on to the Department, it is acknowledged that they have the potential to drive other risks. As such, the mitigation listed in these four areas can be implemented in conjunction with and in support of strategies tied to other risk areas. For example, Implementation Risk mitigation strategies – like improving upon its existing governance structures and oversight regimes – will benefit from the proposed mitigation for the HR Risk. Working with Health Canada on shared IT needs for Information for Decision-making Risk supports other efforts on Government Partnership Risk.
Corporate risk mitigation strategies will be finalized in Q3 and along with financial risk mitigation activities will be reflected in the Corporate Business Plan. Risk mitigation activities are monitored by senior management on a quarterly basis and modified as required. In addition to corporate risk profiling, individual risk assessments are being conducted at the program level in order to mitigate each program's residual risks. At the end of the second quarter, seven regions have risk profiles in place.
4. Significant Changes in Relation to Operations, Personnel and Programs
Significant changes in relation to Operations, Personnel and Programs during the second quarter of fiscal year 2012-13 include:
- The Office of the Federal Interlocutor has been realigned and its programs were distributed to both the Policy and Strategic Direction sector and the Regional Operations sector. Policy and Strategic Direction's new Aboriginal and External Relations Branch integrates many of the functions previously performed by the Office of the Federal Interlocutor and the Inuit Relations Secretariat. Regional Operations now delivers the Urban Aboriginal Strategy to better align program and service delivery efforts at HQ and in regions.
5. Budget 2012 Implementation
This section provides an update of the savings measures announced in Budget 2012 that are being implemented in order to refocus government and programs; make it easier for Canadians and business to deal with their government; and, modernize and reduce the back office.
Aboriginal Affairs and Northern Development Canada will achieve savings of $24.4 million in the first year. Savings will increase to $55.1 million in 2013-14 and will result in ongoing savings of $160.6 million by 2014-15.
For the quarter ending September 30, 2012, Budget 2012 impacts on the Department's authorities as approved in the Main Estimates and Supplementary estimates (A) 2012-2013 have been minimal as the Department is in the early stages of implementation.
There are no significant financial risks or uncertainties related to Budget 2012 savings for this quarterly financial report. AANDC continues to manage the implementation of Budget 2012 savings through its financial management and monitoring processes.
In the second quarter, the Department continued to focus on decreasing the costs of internal operations. In order to minimize the impact on employees and reduce transitional support measure costs, the following occurred in the second quarter:
- Abolition of a number of vacant funded positions;
- Deployment of many affected employees to other vacant positions in the Department and in other government departments; and,
- Facilitation of voluntary departures and retirements of affected and non-affected employees, where appropriate.
In addition, the Department initiated and completed a number of Selection of Employees for Retention or Lay-off processes for affected employees.
Several internal operational changes continue to be implemented in order to deliver efficient, effective and accountable programs for Aboriginal peoples and Northerners. Progress was made a number of change initiatives, including:
- Consolidation of administrative service units (e.g., Human Resources, Accounting);
- Re-alignment of internal structures by consolidating functions and aligning similar roles in order to more efficiently deliver on the Department's mandate; and,
- Reductions in spending on travel, hospitality, temporary help services, management and technology consultants and other professional services.
Also in the second quarter, the Minister also announced changes to AANDC funding for Aboriginal Representative Organizations and Tribal Councils, which will make funding more equitable among organizations across the country, and ensure it is focused on shared priorities: education, economic development, on-reserve infrastructure, land management and governance programs.
In order to manage deficit reduction savings implementation, an Implementation Committee, chaired by the Associate Deputy Minister and comprising the Assistant Deputy Ministers and direct reports to the Deputy Minister, has been convened to provide overall direction, coordination and oversight to all implementation activities. A Workforce Management Board has also been put in place to provide oversight on workforce management mechanisms and to ensure consistency and fairness in human resource decisions across the department.
Budget 2012 - Impact on Departmental Funding Levels
($ millions)
| Economic Action Plan 2012 (Budget 2012) | ||||
| Strategic Investments | 2012-13 | 2013-14 | 2014-15 | 3-Year Total |
|---|---|---|---|---|
| Aboriginal Peoples | ||||
| Investments to Improve First Nations Water Infrastructure | 138.0 | 138.0 | - | 276.0 |
| Investments to Improve First Nations Education | 45.0 | 115.0 | 115.0 | 275.0 |
| Urban Aboriginal Strategy | 13.5 | 13.5 | 13.5 * | 40.5 |
| Addressing Family Violence on Reserve | 11.9 | - | - | 11.9 |
| Sub-Total (Aboriginal Peoples) | 208.4 | 266.5 | 128.5 | 603.4 |
| Aboriginal and Northern Communities | ||||
| Assessing Diamonds in the North (5 years) | 6.2 | 6.2 | 6.2 | 18.6 |
| Major Projects Management Office Initiative | 1.8 | 1.8 | 1.8 | 5.4 |
| Sub-Total (Aboriginal and Northern Communities) | 8.0 | 8.0 | 8.0 | 24.0 |
| Total Strategic Investments | 216.4 | 274.5 | 136.5 | 627.4 |
| Less: Planned Reductions in Departmental Spending | ||||
| Restructuring, operational efficiencies and changes to business processes, and other savings initiatives (excludes reductions $12.5M for the First Nations Statistical Institute) | (24.4) | (55.1) | (160.6) * | (240.1) |
| Net Impact of Economic Action Plan 2012 | 192.0 | 219.4 | (24.2) | 387.3 |
* Ongoing
Figures may not add due to rounding
This table represents only the AANDC investments and reductions and not those of other organizations within the Ministerial portfolio.
6. Approval by Senior Officials
Approved, as required by the Treasury Board Policy on Financial Resource Management, Information and Reporting:
Deputy Minister
Chief Financial Officer
| Fiscal year 2012-2013 | Fiscal year 2011-2012 | ||||||
|---|---|---|---|---|---|---|---|
| Vote | (thousands of dollars) | Total available for use for the year ending March 31, 2013 * | Expended during the quarter ended September 30, 2012 | Year to date used at quarter-end | Total available for use for the year ending March 31, 2012 | Expended during the quarter ended September 30, 2011 | Year to date used at quarter-end |
| 1 | Operating Expenditures | 1,208,367 | 270,988 | 480,472 | 1,056,182 | 334,359 | 545,359 |
| 5 | Capital Expenditures | 22,973 | 389 | 815 | 12,194 | 444 | 592 |
| 10 | Grants and contributions | 6,560,595 | 1,244,017 | 2,863,344 | 6,067,689 | 1,426,763 | 2,891,455 |
| (S) | Budgetary statutory authorities - Operating Expenditures: | ||||||
| Contributions to employee benefit plans | 65,049 | 16,262 | 32,524 | 71,154 | 17,789 | 35,577 | |
| Minister of Aboriginal Affairs and Northern Development – Salary and motor car allowance | 78 | 19 | 39 | 78 | 19 | 39 | |
| Payments to comprehensive claim beneficiaries in compensation for resource royalties | 2,591 | 1,126 | 3,376 | 2,575 | 585 | 585 | |
| Liabilities in respect of loan guarantees made to Indians for Housing and Economic Development | 2,000 | 0 | 6 | 2,000 | 0 | 0 | |
| Grassy Narrows and Islington Bands Mercury Disability Board | 15 | 0 | 0 | 15 | 0 | 0 | |
| Other | 777 | 1,346 | 836 | 951 | |||
| (S) | Budgetary statutory authorities - Transfer Payments: | ||||||
| Grants to Aboriginal organizations designated to receive claim settlement payments pursuant to Comprehensive Land Claim Settlement Acts | 75,576 | 21,033 | 53,569 | 90,416 | 24,345 | 61,375 | |
| Grant to the Nunatsiavut Government for the implementation of the Labrador Inuit Land Claims Agreement pursuant to the Labrador Inuit Land Claims Agreement Act | 17,987 | 0 | 0 | 17,987 | 0 | 0 | |
| Indian Annuities Treaty payments | 1,400 | (349) | 1,837 | 1,400 | (332) | 1,966 | |
| Total Budgetary Authorities | 7,956,631 | 1,554,262 | 3,437,328 | 7,321,689 | 1,804,808 | 3,537,899 | |
| Non-Budgetary Authorities: | |||||||
| Loans to native claimants | 47,403 | 4,684 | 4,684 | 47,403 | 4,090 | 4,969 | |
| Loans to First Nations in British Columbia for the purpose of supporting their participation in the British Columbia Treaty Commission Process | 31,200 | 7,337 | 9,616 | 30,400 | 9,004 | 11,780 | |
| Total Non-Budgetary Authorities | 78,603 | 12,021 | 14,300 | 77,803 | 13,094 | 16,749 | |
| Total Authorities | 8,035,234 | 1,566,283 | 3,451,628 | 7,399,492 | 1,817,902 | 3,554,648 | |
Figures may not add due to rounding.
Including only Authorities available for use and granted by Parliament at quarter-end. Total available for use does not reflect measures announced in Budget 2012.
Footnote: Pursuant to s. 31.1 of the Financial Administration Act and Order in Council P.C. 2012-286 effective April 1, 2012, $39,481,400 is deemed to have been appropriated to Indian Affairs and Northern Development Votes 1 ($780,420) and 10 ($38,700,980), which results in a reduction in the Canadian Heritage Votes 1 and 5 Appropriation Act No. 1, 2012-13.
| Fiscal year 2012-2013 | Fiscal year 2011-2012 | ||||||
|---|---|---|---|---|---|---|---|
| # | Expenditures | Planned expenditures for the year ending March 31, 2013 * | Expended during the quarter ended September 30, 2012 | Year to date used at quarter-end | Planned expenditures for the year ending March 31, 2012 | Expended during the quarter ended September 30, 2011 | Year to date used at quarter-end |
| 1 | Personnel | 436,074 | 119,718 | 240,179 | 466,533 | 151,453 | 271,215 |
| 2 | Transportation and communications | 48,907 | 7,946 | 11,967 | 56,090 | 9,238 | 14,571 |
| 3 | Information | 11,351 | 3,642 | 5,456 | 14,274 | 2,811 | 3,211 |
| 4 | Professional and special services | 285,728 | 38,909 | 53,398 | 266,987 | 62,354 | 76,581 |
| 5 | Rentals | 10,802 | 3,341 | 4,333 | 11,966 | 2,875 | 3,815 |
| 6 | Purchased repair and maintenance | 5,937 | 281 | 380 | 5,277 | 805 | 1,036 |
| 7 | Utilities, materials and supplies | 9,117 | 1,021 | 1,702 | 8,820 | 1,285 | 1,970 |
| 8 | Acquisition of land, buidlings and works | 17,114 | 0 | 0 | 12,194 | 3 | 3 |
| 9 | Acquisition of machinery and equipment | 20,000 | 1,435 | 1,780 | 20,000 | 1,658 | 2,456 |
| 10 | Transfer Payments | 6,655,559 | 1,262,413 | 2,916,463 | 6,177,492 | 1,450,778 | 2,954,797 |
| 12 | Other subsidies and payments | 456,040 | 115,556 | 201,670 | 282,056 | 121,548 | 208,244 |
| Total gross budgetary expenditures | 7,956,631 | 1,554,262 | 3,437,328 | 7,321,689 | 1,804,808 | 3,537,899 | |
| Less: Revenues netted against expenditures: | |||||||
| Total Revenues netted against expenditures | - | 0 | 0 | 0 | 0 | 0 | |
| Total net budgetary expenditures | 7,956,631 | 1,554,262 | 3,437,328 | 7,321,689 | 1,804,808 | 3,537,899 | |
Figures may not add due to rounding.
* Planned expenditures do not reflect measures announced in Budget 2012.