Archived - Aboriginal Affairs and Northern Development Canada Quarterly Financial Report - For the quarter ended June 30, 2012
Archived information
This Web page has been archived on the Web. Archived information is provided for reference, research or record keeping purposes. It is not subject to the Government of Canada Web Standards and has not been altered or updated since it was archived. Please contact us to request a format other than those available.
1. Introduction
This quarterly financial report has been prepared by management as required by section 65.1 of the Financial Administration Act and in the form and manner prescribed by the Treasury Board. It should be read in conjunction with the Main Estimates and Supplementary Estimates (A) for fiscal year 2012-13 as well as Canada's Economic Action Plan 2012 (Budget 2012). For purposes of both the Main and Supplementary Estimates, the Department is referred to as Indian Affairs and Northern Development.
The quarterly financial report has not been subject to an external audit or review.
1.1 Authority, Mandate and Program Activities
Aboriginal Affairs and Northern Development Canada (AANDC) supports Aboriginal people (First Nations, Inuit and Métis) and Northerners in their efforts to:
- Improve social well-being and economic prosperity;
- Develop healthier, more sustainable communities; and
- Participate more fully in Canada's political, social and economic development – to the benefit of all Canadians.
AANDC is one of the federal departments responsible for meeting the Government of Canada's obligations and commitments to First Nations, Inuit and Métis, and for fulfilling the federal government's constitutional responsibilities in the North. AANDC's responsibilities are largely determined by numerous statutes, negotiated agreements and legal decisions.
Most of the Department's program spending is delivered through partnerships with Aboriginal communities and federal-provincial or federal-territorial agreements. AANDC also works with urban Aboriginal persons, Métis and Non-Status Indians (many of whom live in rural areas) through the Office of the Federal Interlocutor.
Further details on AANDC's authority, mandate and program activities can be found in Part II of the Main Estimates and the Report on Plans and Priorities.
1.2 Basis of Presentation
This quarterly report has been prepared by management using an expenditure basis of accounting and a special purpose financial reporting framework designed to meet financial information needs with respect to the use of spending authorities. The accompanying Statement of Authorities includes AANDC's spending authorities granted by Parliament and those used by the Department consistent with the Main Estimates and Supplementary Estimates (A) for the 2012-2013 fiscal year.
The authority of Parliament is required before monies can be spent by the Government. Approvals are given in the form of annually approved limits through appropriation acts or through legislation in the form of statutory spending authority for specific purposes.
As part of the Parliamentary business of supply, the Main Estimates must be tabled in Parliament on or before March 1 preceding the new fiscal year. Budget 2012 was tabled in Parliament on March 29, after the tabling of the Main Estimates on February 28, 2012. As a result the measures announced in the Budget 2012 are not reflected in the 2012-13 Main Estimates.
In fiscal year 2012-2013, frozen allotments will be established by Treasury Board authority in departmental votes to prohibit the spending of funds already identified as savings measures in Budget 2012. In future years, the changes to departmental authorities will be implemented through the Annual Reference Level Update, as approved by Treasury Board, and reflected in the subsequent Main Estimates tabled in Parliament.
The Department uses the full accrual method of accounting to prepare and present its annual departmental financial statements that are part of the departmental performance reporting process. However, the spending authorities voted by Parliament remain on an expenditure basis.
1.3 AANDC's Financial Structure
The parliamentary vote structure of AANDC is made up of $7.9 billion in budgetary authorities of which $7.8 billion requires approval by Parliament; referred to as voted amounts. The remaining $164.7 million represents statutory authorities that do not require additional approval and are provided for information purposes.
Voted amounts totalling $7.8 billion are split between Operating Expenditures, Capital Expenditures and Grants and Contributions as follows:
- Operating Expenditures represents approximately $1.2 billion (15.1%), this includes $439.4 million (5.7%) for the Settlement Allotment (Independent Assessment Process and Alternative Dispute Resolution)
- Capital represents approximately $22.0 million (0.3%)
- Grants and Contributions represent approximately $6.6 billion (84.6%)
More detailed information can be found online about AANDC's financial structure, including information about the fiscal cycle, cost drivers, expenditure trends, etc.
2. Highlights of Fiscal Quarter and Fiscal Year-to-Date (YTD) Results
This section highlights the significant items that contributed to the net increase or decrease in resources available for the year and actual expenditures for the quarter ended June 30, 2012. The explanation of variances considers that changes under 5% would have minimal impact on interpretation of results.
2.1 Statement of Authorities (Table 1)
The Quarterly Financial Report reflects the results of the current fiscal period in relation to the Main Estimates and Supplementary Estimates (A) for the quarter ended June 30, 2012. Total authorities available for use were $7,995.7 million compared to $7,386.1 million for the same quarter of the prior year, representing a total increase of $609.6 million (Table 1).
The $609.6 million increase can be explained by the following major items:
| Program | Increase / (Decrease) in Authorities Available For Use ($ millions) |
|||||
|---|---|---|---|---|---|---|
| Operating * | Capital | Grants and Contributions * |
Non-Budgetary | Total | ||
| * Includes statutory authorities
** e.g. Canada's Clean Air Agenda, Beaufort Regional Environmental Assessment, First Nations Child and Family Services Programs, Northwest Territories land and resources devolution, Canadian High Arctic Research Station and sunset of funding for Urban Aboriginal Strategy and Family Violence Prevention Program Note: Figures may not add due to rounding |
||||||
| a. | Funding for negotiation, settlement and implementation of specific and comprehensive claims | (16.5) | 4.3 | 439.1 | 0.8 | 427.7 |
| b. | Funding for the assessment, management and remediation of federal contaminated sites | 96.3 | 41.4 | 137.8 | ||
| c. | Funding to meet increased demand for ongoing Indian and Inuit programs providing access to basic services such as education and social support services | 0.3 | 98.6 | 98.9 | ||
| d. | Funding for awards to claimants resulting from the Independent Assessment Process and Alternative Dispute Resolution related to the Indian Residential Schools Settlement Agreement | 73.3 | (0.6) | 72.7 | ||
| e. | Transfer from Canadian Heritage for the Urban Aboriginal Youth and Community Unit | 0.8 | 38.7 | 39.5 | ||
| f. | Funding to support tripartite education agreements with First Nations in British Columbia and to advance readiness for education comparability in other provinces through the Education Partnerships Program | 23.1 | 23.1 | |||
| g. | Funding to upgrade, repair or replace essential fuel storage tanks in First Nation communities under the Capital Facilities and Maintenance Program | 12.0 | 12.0 | |||
| h. | Funding for legislative and regulatory changes to improve the northern regulatory system and to implement the Cumulative Impact Monitoring Program in the Northwest Territories and Nunavut | 7.6 | 2.6 | 10.2 | ||
| i. | Other various initiatives (net) ** | (2.5) | 5.4 | 13.3 | 16.2 | |
| j. | Sunset of funding for First Nations Water and Wastewater Action Plan | (11.3) | (147.9) | (159.2) | ||
| k. | Decrease reflecting the approved funding for the First Nations Infrastructure Fund | (0.7) | (42.3) | (43.0) | ||
| l. | Decrease reflecting the transfer of funding to Shared Services Canada for information technology services | (26.4) | (26.4) | |||
| 1st Qtr. | Total increase / (decrease) to Departmental Authorities | 120.9 | 9.8 | 478.1 | 0.8 | 609.6 |
- As shown in the table above, the $609.6 million increase in total authorities is primarily attributed to an increase of funding in Operating expenditures ($120.9M) and Grants and Contributions ($478.1M).
- The increase of $120.9 million in Operating expenditures is primarily due to the renewal of funding for the assessment, management and remediation of federal contaminated sites ($96.3M) and an increase of funding for the Indian Residential Schools Settlement Agreement ($73.3M). The $120.9 million increase is partially offset by the transfer of funding to Shared Services Canada for information technology services ($26.4M).
- The increase of $478.1 million in Grants and Contributions is primarily due to the $439.1 million increase in funding for claims activities, notably for the settlement of the Coldwater-Narrows Specific Claim ($307.2M) and funding to meet increased demand for ongoing Indian and Inuit programs providing access to basic services such as education and social support services ($98.6M). This increase is partially offset by the sunset of funding for First Nations Water and Wastewater Action Plan ($147.9M).
2.2 Statement of Departmental Budgetary Expenditures by Standard Object (Table 2)
Highlights of Fiscal Quarter ended June 30, 2012
Departmental spending in the first quarter of 2012-13 was $150M higher than the same period in 2011-12. This net increase of 8.6% can be attributed mainly to an increase of $150M in transfer payments (standard object 10) issued as a specific claims settlement for the Cote Specific Claim in the amount of $131M and to support public services in Education in the amount of $19M.
Year-to-Date Comparison of Budgetary Authorities and Expenditures as of the end of June 2012 ($ millions)
Year-to-Date Comparison of Budgetary Authorities and Expenditures as of the end of June 2012 ($ millions)
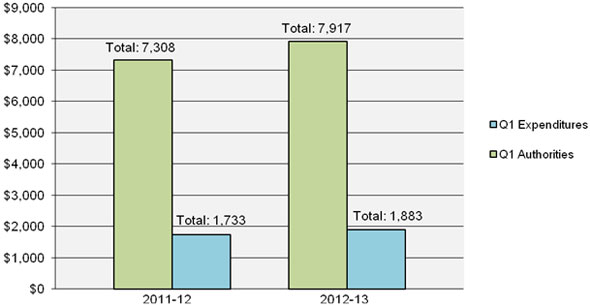
This image is of a bar graph of the year-to-date comparison of budgetary authorities and expenditures as of the end of June 30th, 2012. The graph plots the authorities and expenditures by quarter arriving at a year to date total for the fiscal years 2011-12 and 2012-13.
The 2011-12 data shows the Q1 authorities equaling the Main Estimates and the Supplementary Estimates A authorities arriving at the total authority at the end of Q1 of $7,386.1M. The 2012-2013 data shows the Q1 authorities equaling the Main Estimates and the Supplementary Estimates A authorities arriving at the total authority at the end of Q1 of $7,995.7M.
The net difference in comparing the authorities at the end of Q1 each fiscal year is an increase of $609.6M from 2011-12 to 2012-13.
The second column of each section of the graph pertains to expenditures. The 2011-12 data shows the Q1 expenditures of $1,721M. The 2012-13 data shows the Q1 expenditures of $1,883M. The net difference in comparing the expenditures at the end of Q1 each fiscal year is an increase of $162M from 2011-12 to 2012-13.
3. Risks and Uncertainties
3.1 Risks and Uncertainties
AANDC continues to carry out its mandate in an operating environment that is complex and continually evolving. A key factor in Canada's changing demographic landscape is the growing Aboriginal population, which is young and growing at twice the rate of the overall Canadian population. This growth brings increasing demands for services - Aboriginal people in Canada continue to attain lower levels of education, have poorer health and quality of life, and higher levels of unemployment than the overall Canadian population. External stakeholders have presented their visions for reform through the Education Reform Report (2011) and the Report of the National Panel on First Nation Elementary and Secondary Education for Students on Reserve (2012). The recommendations in these reports and others should inform ongoing reform activities. The growing Aboriginal population presents an unprecedented opportunity to harness the potential of capable, educated Aboriginal youth to fill crucial labour shortages now and in the future. For this to happen, the Department requires an integrated set of plans, policies and programs to foster and build on the economic advancements resulting from the increasing employment opportunities and wealth that is being created by Aboriginal businesses and communities.
In addition, AANDC delivers or funds programs and services to diverse groups of people (First Nations, Inuit, Métis and Northerners) who have varied and distinct priorities and needs, and who live in a vast range of communities throughout the country – from remote settlements with extreme climates to metropolitan urban areas. Most AANDC services are delivered through partnerships with Aboriginal communities, the provinces and territories, Aboriginal organizations and organizations in the North. AANDC's success is therefore highly dependent on strong and productive relationships. Through the implementation of the Policy on Transfer Payments, risk-based approaches in the management and monitoring of program-related funds allows the Department to target efforts and help build capacity in areas where it is most needed. Funding flexibility, based on risk, also helps to maintain and strengthen relationships with First Nation communities.
The Department's legal and operating environments are complex and continually evolving. AANDC is the lead department responsible for the negotiation and implementation of self-government and land claims agreements. Comprehensive land claims agreements and self-government agreements are legally binding, and are given further legal effect through implementing legislation. Many are also constitutionally protected under section 35 of the Constitution Act, 1982. Supreme Court and other court rulings on Aboriginal and treaty rights have a major impact on AANDC's mandate and the way the Department works to fulfil the Crown's legal obligations. Canada's historic relationship with Aboriginal peoples and the ongoing refinement of constitutional concepts and questions add to the complexity of litigation, as well as expose the Government of Canada to landmark court decisions and significant financial liabilities.
3.2 Risk Mitigating Strategies
As mentioned in relation to financial management, risk management is becoming a critical component of managing resources in order to meet departmental objectives. The Department is currently in the process of updating its risk profile for 2012-13. The business conditions mentioned above have been considered in the development of risk statements and a risk assessment will take place over the summer. In addition to corporate risk profiling, individual risk assessments are being conducted at the program level in order to mitigate each program's residual risks and more of the Department's regional offices are developing risk profiles within the context of each region.
4. Significant changes in relation to Operations, Personnel and Programs
Significant changes in relation to Operations, Personnel and Programs during the first quarter of fiscal year 2012-13 include:
- Bernard Etzinger was appointed Acting Director General of Communications Branch as of June 26, 2012.
- Josée Touchette joined the department on June 18, 2012 as Senior Assistant Deputy Minister, Policy and Strategic Direction
- While Elizabeth Tromp will remain Assistant Deputy Minister for the Office of the Federal Interlocutor until September 2012, she assumed additional responsibilities as Associate Assistant Deputy Minister to Ron Hallman, the Senior Assistant Deputy Minister, Regional Operations effective May 7, 2012.
- AANDC permanently transferred $26.4 million to Shared Services Canada (SSC) for information technology services including email, data centre and network services. 63 FTEs were transferred to SSC.
- AANDC received $39.5 million from Canadian Heritage for the Urban Aboriginal Youth and Community Programs Unit. 13 FTEs were transferred to AANDC.
5. Budget 2012 Implementation
This section provides an overview of the savings measures announced in Budget 2012 that will be implemented in order to refocus government and programs; make it easier for Canadians and business to deal with their government; and, modernize and reduce the back office.
Aboriginal Affairs and Northern Development Canada, like every other department, is contributing to the effort to eliminate the deficit. As part of measures announced in Budget 2012, the Department will achieve savings of $24.4 million in the first year. Savings will increase to $55.1 million in 2013-14 and will result in ongoing savings of $160.6 million by 2014-15.
As the department implements these savings over this fiscal year, it will protect the delivery of core services, while it focuses on improving how we achieve progress and results for Aboriginal people and economies.
In order to achieve these savings, the department will be focusing on ways to decrease the costs of internal operations to the extent possible. AANDC is targeting internal operations, streamlining program management and business processes to deliver efficient, effective and accountable programs. AANDC will continue to work with First Nations to eliminate duplication of efforts and to improve service delivery to communities.
In order to manage deficit reduction savings implementation, an Implementation Committee, chaired by the Associate Deputy Minister and comprising the Assistant Deputy Ministers and direct reports to the Deputy Minister, has been convened to provide overall direction, coordination and oversight to all implementation activities. A Workforce Management Board has also been put in place to provide oversight on workforce management mechanisms and to ensure consistency and fairness in human resource decisions across the department.
Budget 2012 - Impact on Departmental Funding Levels ($ millions)
| Economic Action Plan 2012 (Budget 2012) | ||||
| Strategic Investments | 2012-13 | 2013-14 | 2014-15 | 3-Year Total |
|---|---|---|---|---|
| * Ongoing
Figures may not add due to rounding This table represents only the AANDC investments and reductions and not those of other organizations within the Ministerial portfolio. |
||||
| Aboriginal Peoples | ||||
| Investments to Improve First Nations Water Infrastructure | 138.0 | 138.0 | - | 276.0 |
| Investments to Improve First Nations Education | 45.0 | 115.0 | 115.0 | 275.0 |
| Urban Aboriginal Strategy | 13.5 | 13.5 | 13.5 * | 40.5 |
| Addressing Family Violence on Reserve | 11.9 | - | - | 11.9 |
| Sub-Total (Aboriginal Peoples) | 208.4 | 266.5 | 128.5 | 603.4 |
| Aboriginal and Northern Communities | ||||
| Assessing Diamonds in the North (5 years) | 6.2 | 6.2 | 6.2 | 18.6 |
| Major Projects Management Office Initiative | 1.8 | 1.8 | 1.8 | 5.4 |
| Sub-Total (Aboriginal and Northern Communities) | 8.0 | 8.0 | 8.0 | 24.0 |
| Total Strategic Investments | 216.4 | 274.5 | 136.5 | 627.4 |
| Less: Planned Reductions in Departmental Spending | ||||
| Restructuring, operational efficiencies and changes to business processes, and other savings initiatives (excludes reductions $12.5M for the First Nations Statistical Institute) | (24.4) | (55.1) | (160.6) * | (240.1) |
| Net Impact of Economic Action Plan 2012 | 192.0 | 219.4 | (24.2) | 387.3 |
6. Approval by Senior Officials
Approved, as required by the Treasury Board Policy on Financial Resource Management, Information and Reporting:
Deputy Minister
Chief Financial Officer
| Fiscal year 2012-2013 | Fiscal year 2011-2012 | ||||||
|---|---|---|---|---|---|---|---|
| Vote | Expenditures | Total available for use for the year ending March 31, 2013 * | Expended during the quarter ended June 30, 2012 | Year to date used at quarter-end | Total available for use for the year ending March 31, 2012 | Expended during the quarter ended June 30, 2011 | Year to date used at quarter-end |
| * Including only Authorities available for use and granted by Parliament at quarter-end. Total available for use does not reflect measures announced in Budget 2012.
Footnote: Pursuant to s. 31.1 of the Financial Administration Act and Order in Council P.C. 2012-286 effective April 1, 2012, $39,481,400 is deemed to have been appropriated to Indian Affairs and Northern Development Votes 1 ($780,420) and 10 ($38,700,980), which results in a reduction in the Canadian Heritage Votes 1 and 5 Appropriation Act No. 1, 2012-13. |
|||||||
| 1 | Operating Expenditures | 1,169,832 | 209,484 | 209,484 | 1,042,799 | 211,000 | 211,000 |
| 5 | Capital Expenditures | 21,953 | 426 | 426 | 12,194 | 148 | 148 |
| 10 | Grants and contributions | 6,560,595 | 1,619,327 | 1,619,327 | 6,067,689 | 1,464,692 | 1,464,692 |
| (S) | Budgetary statutory authorities - Operating Expenditures: | ||||||
| Contributions to employee benefit plans | 65,049 | 16,262 | 16,262 | 71,154 | 17,789 | 17,789 | |
| Minister of Aboriginal Affairs and Northern Development – Salary and motor car allowance | 78 | 19 | 19 | 78 | 19 | 19 | |
| Payments to comprehensive claim beneficiaries in compensation for resource royalties | 2,591 | 2,250 | 2,250 | 2,575 | 0 | 0 | |
| Liabilities in respect of loan guarantees made to Indians for Housing and Economic Development | 2,000 | 6 | 6 | 2,000 | 0 | 0 | |
| Grassy Narrows and Islington Bands Mercury Disability Board | 15 | 0 | 0 | 15 | 0 | 0 | |
| Other | - | 569 | 569 | - | 116 | 116 | |
| (S) | Budgetary statutory authorities - Transfer Payments: | ||||||
| Grants to Aboriginal organizations designated to receive claim settlement payments pursuant to Comprehensive Land Claim Settlement Acts | 75,576 | 32,536 | 32,536 | 90,416 | 37,030 | 37,030 | |
| Grant to the Nunatsiavut Government for the implementation of the Labrador Inuit Land Claims Agreement pursuant to the Labrador Inuit Land Claims Agreement Act | 17,987 | 0 | 0 | 17,987 | 0 | 0 | |
| Indian Annuities Treaty payments | 1,400 | 2,186 | 2,186 | 1,400 | 2,297 | 2,297 | |
| Total Budgetary Authorities | 7,917,075 | 1,883,065 | 1,883,065 | 7,308,306 | 1,733,091 | 1,733,091 | |
| Non-Budgetary Authorities: | |||||||
| Loans to native claimants | 47,403 | 0 | 0 | 47,403 | 880 | 880 | |
| Loans to First Nations in British Columbia for the purpose of supporting their participation in the British Columbia Treaty Commission Process | 31,200 | 2,278 | 2,278 | 30,400 | 2,775 | 2,775 | |
| Total Non-Budgetary Authorities | 78,603 | 2,278 | 2,278 | 77,803 | 3,655 | 3,655 | |
| Total Authorities | 7,995,678 | 1,885,343 | 1,885,343 | 7,386,109 | 1,736,747 | 1,736,747 | |
| Fiscal year 2012-2013 | Fiscal year 2011-2012 | ||||||
|---|---|---|---|---|---|---|---|
| # | Expenditures | Planned expenditures for the year ending March 31, 2013 * | Expended during the quarter ended June 30, 2012 | Year to date used at quarter-end | Planned expenditures for the year ending March 31, 2012 | Expended during the quarter ended June 30, 2011 | Year to date used at quarter-end |
| * Planned expenditures do not reflect measures announced in Budget 2012. | |||||||
| 1 | Personnel | 436,074 | 120,461 | 120,461 | 466,533 | 119,762 | 119,762 |
| 2 | Transportation and communications | 43,839 | 4,021 | 4,021 | 54,024 | 5,333 | 5,333 |
| 3 | Information | 10,175 | 1,814 | 1,814 | 13,748 | 400 | 400 |
| 4 | Professional and special services | 256,118 | 14,489 | 14,489 | 257,155 | 14,227 | 14,227 |
| 5 | Rentals | 9,683 | 992 | 992 | 11,525 | 940 | 940 |
| 6 | Purchased repair and maintenance | 5,322 | 99 | 99 | 5,083 | 231 | 231 |
| 7 | Utilities, materials and supplies | 8,173 | 681 | 681 | 8,496 | 685 | 685 |
| 8 | Acquisition of land, buidlings and works | 16,094 | 0 | 0 | 12,194 | 0 | 0 |
| 9 | Acquisition of machinery and equipment | 20,000 | 345 | 345 | 20,000 | 798 | 798 |
| 10 | Transfer Payments | 6,655,559 | 1,654,050 | 1,654,050 | 6,177,492 | 1,504,019 | 1,504,019 |
| 12 | Other subsidies and payments | 456,040 | 86,114 | 86,114 | 282,056 | 86,696 | 86,696 |
| Total gross budgetary expenditures | 7,917,075 | 1,883,065 | 1,883,065 | 7,308,306 | 1,733,091 | 1,733,091 | |
| Less: Revenues netted against expenditures: | |||||||
| Total Revenues netted against expenditures | - | 0 | 0 | 0 | 0 | 0 | |
| Total net budgetary expenditures | 7,917,075 | 1,883,065 | 1,883,065 | 7,308,306 | 1,733,091 | 1,733,091 | |