Plain Language Summary of the Risk Assessment for the Giant Mine
Prepared by: Canada North Environmental Services Markham, Ontario
Prepared for: Public Services and Procurement Canada – Western Region
Environmental Services and Contaminated Sites Management
5th Floor, ATB Place, 10025 Jasper Avenue
Edmonton, Alberta T5J 1S6
Project No. 2385
January 2018
Introduction
The Giant Mine is a former gold mine located in Yellowknife, Northwest Territories (NWT), about five kilometers (5 km) north of the city center. The Giant Mine was in operation until 2004. Tailings are stored in four areas on the Giant Mine and dust containing high levels of arsenic was pumped into sealed underground storage areas. In the past, releases to the air resulted in contamination of soil in the area. Baker Creek flows through the site, and the water and sediments of Baker Creek contain high levels of arsenic as well as other contaminants.
In 2010, the Environmental Assessment Report for the Giant Mine Remediation Project was submitted to the Mackenzie Valley Environmental Impact Review Board (MVEIRB). The MVEIRB indicated that a comprehensive quantitative Human Health Risk Assessment was needed before they would give regulatory approvals. In addition, an Ecological Risk Assessment was carried out to evaluate potential risks to wildlife and plants at the Giant Mine.
What is a Risk Assessment?
A Human Health and Ecological Risk Assessment is a scientific process used to answer:
- What are we concerned about? – arsenic is an issue, but are there other chemicals?
- Who is being exposed? – people, wildlife, or vegetation.
- How are they being exposed? –food, drinking water, soil, dust.
This is shown in Figure 1. All three of these questions need to be answered before determining if there is a risk. For this study we looked at what changes to risk might happen once the Giant Mine has been cleaned up. Risk assessment looks at exposure across a community and not at any one individual person. The ongoing, separate Health Effects Monitoring Program looks at individuals.
The risk assessment follows guidance outlined by Health Canada and Environment and Climate Change Canada and over 200 reports were reviewed for information to be used in the risk assessment.
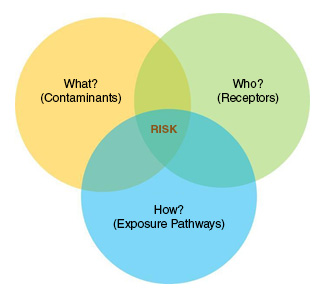
Description of Figure 1: What is a risk assessment?
Figure 1 shows a Venn diagram with three overlapping circles, labelled What? (Contaminants), Who? (Receptors) and How? (Exposure Pathways). Where the three circles intersect is labelled Risk.
Who provided information?
Information was gathered from interested people through the Giant Mine Working Group (WG). The WG is made up of members from Indian and Northern Affairs Canada (INAC), Government of Northwest Territories (GNWT), Public Services and Procurement Canada (PSPC), Environment and Climate Change Canada (ECCC), Department of Fisheries and Oceans (DFO), City of Yellowknife, Alternatives North, Yellowknives Dene First Nation (YKDFN), North Slave Metis Alliance (NSMA), Health Canada, Giant Mine Oversight Board, and Bill Slater, who is a technical consultant to the WG. It took a year of talking with people to determine what the risk assessment should cover before the project was started. During the project, there were five meetings with the WG to discuss the approach and results.
Members from the YKDFN and NSMA gave samples of wild game, berries, medicinal plants, and fish that were sent to the lab for analysis and also provided Traditional Knowledge in the dietary survey. Over 130 samples were collected, and the YKDFN gave most of the samples.
Human Health Risk Assessment
Who is being exposed?
People who live in the Ndilo and Dettah communities were included, as well as people living in the City of Yellowknife and Latham Island (see Figure 2). In the discussions it was raised that people live along the Ingraham Trail and people camp at the Fred Henne Campground and swim at Long Lake; so these areas were added to in the risk assessment.
Clean up is planned for the Giant Mine and former Townsite and this plan was used to study what would happen in the future.
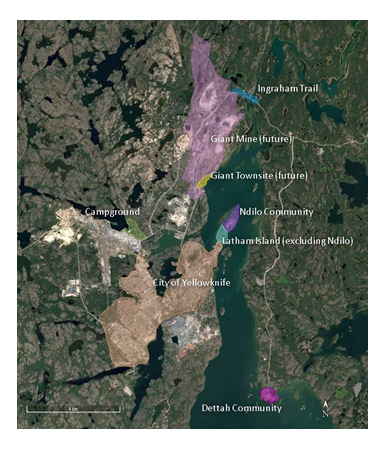
Description of Figure 2: Who is being exposed?
Figure 2 is an aerial map showing the area of the shoreline from either side of Great Slave Lake’s Back Bay from a part of the Ingraham Trail to the community of Dettah. Identified on the map between these points are a campground to the southwest of the Giant Mine, the Giant Mine site area, the Giant Mine townsite area, the community of Ndilo, Latham Island, and the City of Yellowknife, demonstrating where these are in relation to one another.
How are people being exposed?
There are many ways people may be exposed to arsenic and other chemicals (Figure 3). This includes drinking water, breathing air, touching backyard soils and dust from houses (which comes from outdoor soil being brought into the house by shoes), wading or swimming, eating supermarket food, fish, wild game, berries, mushrooms and medicinal plants. All of these were studied in the risk assessment.
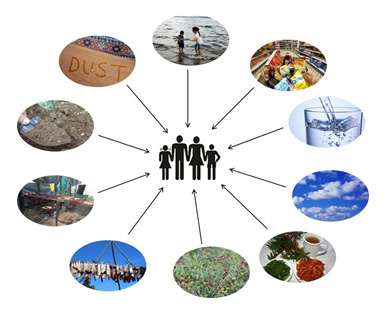
Description of Figure 3: How are people exposed?
Figure 3 shows images with arrows pointing to figures, to demonstrate the different ways people can be exposed to contaminants. Images represented are dust, lake water, prepackaged foods from grocery stores, tap water, the air, tea made from local plants, local berries, local fish, locally-hunted meat, and soil.
What are the contaminants?
Arsenic is the key concern and is known to cause cancer. Other contaminants such as antimony and manganese were also studied; but they were found to be below safe levels, so the rest of the discussion focuses on arsenic.
The levels of arsenic at different locations around Yellowknife are shown for soil (Figure 4), water (Figure 5), and sediments (Figure 6). For soils, Ndilo has the highest levels of arsenic in soils and Dettah has the lowest. The Ingraham Trail arsenic levels in soil are close to those from background locations (like the Yellowknife Greenstone Belt). All arsenic levels in water that people would drink are below the Health Canada Drinking Water Guideline and are close to background levels. As well, most arsenic levels in sediments are close to background levels. Long Lake beach sediments have the highest arsenic levels, which are about three times higher than background levels.
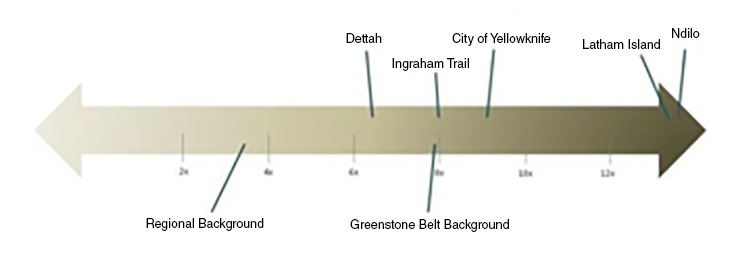
Description of Figure 4: Levels of arsenic in soil
Figure 4 shows a line with arrows at either end, to demonstrate and compare local levels of arsenic in soil. It shows the Regional background level is nearly 4 times the background, Dettah is approximately 6 times, the Greenstone Belt and Ingraham Trail levels are similar at 8 times the background, the City of Yellowknife is nearly 9 times the background, and Latham Island and Ndilo reflect more than 12 times the background.
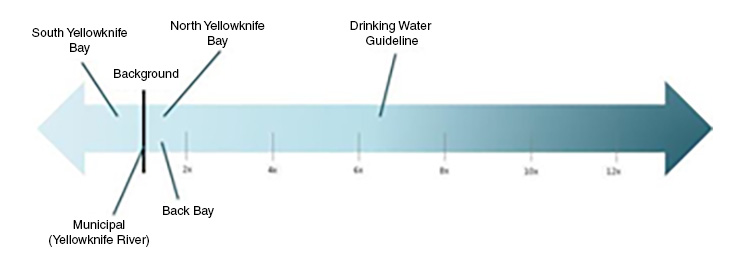
Description of Figure 5: Levels of arsenic in water
Figure 5 shows a line with arrows at either end, to demonstrate and compare local levels of arsenic in water. South Yellowknife Bay is show to have the least arsenic, slightly below the municipal background at Yellowknife River. Back Bay and Yellowknife Bay are shown to be slightly higher at 2 times background, but well below the Drinking Water Guidelines, which are 6 times higher than background levels.
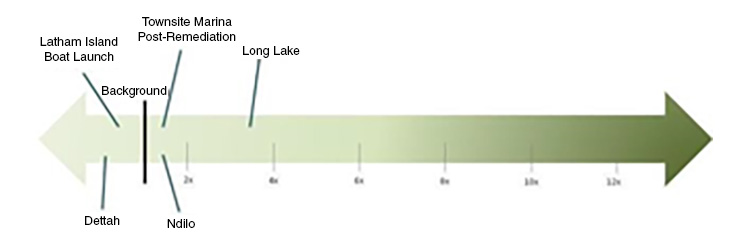
Description of Figure 6: Levels of arsenic in sediments
Figure 6 shows a line with arrows at either end, to demonstrate and compare levels of arsenic in sediments. The Latham Island Boat Launch and Dettah are shown to the left, below background levels. Ndilo and the Townsite post-remediation are shown to be slightly higher, at nearly 2 times the background while Long Lake is shown to be nearly 4 times the background.
What are the levels in country foods?
The following figures show the results of the arsenic levels in the country food samples. Figure 7 shows that the level of arsenic in the different types of fish caught in Yellowknife Bay are similar to background. The levels of arsenic in wild game samples caught within 10 km of the Giant Mine (Figure 8) show that rabbit and ptarmigan/grouse samples were the highest and arsenic levels in beaver and duck are similar to background (from locations more than 50 km from Giant Mine). The levels of arsenic in mushrooms and berries picked from distances greater than 25 km from the Giant Mine (Figure 9) are similar to background (more than 50 km from Giant Mine). It is not surprising that arsenic concentrations in mushrooms within 10 km of the Giant Mine are about seven times higher than background. Certain types of mushrooms store high levels of arsenic; these have not been shown in the figure as the levels are very high and only very small amounts, if any, should be eaten. Rat root samples were collected in the summer of 2017 and the arsenic levels in rat root are low and similar to background.
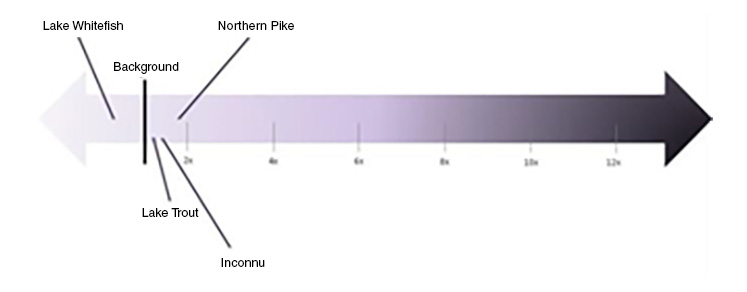
Description of Figure 7: Levels of arsenic in fish in Yellowknife Bay
Figure 7 shows a line with arrows at either end, to demonstrate and compare levels of arsenic in fish. Lake Whitefish are shown to be below background levels, while Lake Trout, Inconnu and Northern Pike are slightly increasing though all below 2 times the background level.
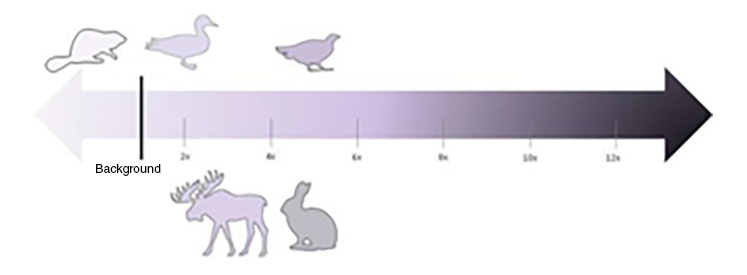
Description of Figure 8: Levels of arsenic in wildlife
Figure 8 shows a line with arrows at either end, to demonstrate and compare levels of arsenic in wildlife. Beaver is below background levels, duck is at 2 times the background level, moose at three times, rabbit and ptarmigan at approximately 4 times the background level.
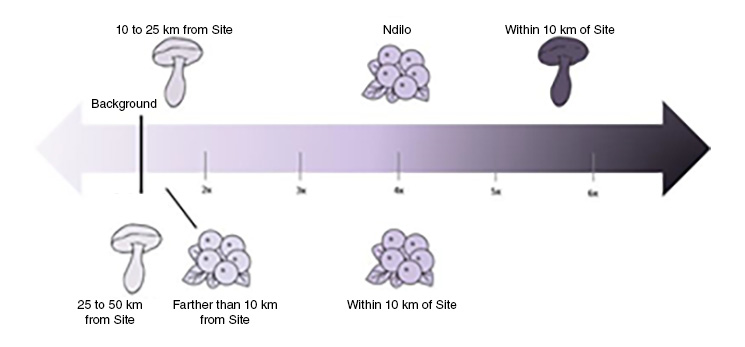
Description of Figure 9: Levels of arsenic in berries and mushrooms
Figure 9 shows a line with arrows at either end to demonstrate and compare levels of arsenic in berries and mushrooms. Mushrooms found 25 to 50 km from the site are at background level, while berries found 10 km and further from site and mushrooms found 10 to 25 km from site are slightly higher than background. Berries in Ndilo and within 10 km of the site were found to be 4 times the background level. Mushrooms within 10 km of the site are nearly 6 times above background levels.
What are the results of the HHRA?
All the information gathered was used along with the amount of the different foods that people said they ate to determine the risk of getting cancer from exposure to arsenic in air, soil, indoor dust, water, sediment, and country foods in the area.
Figure 10 shows that the risks are mainly within the negligible (very tiny) to very low risk range. For people who live in Ndilo, the calculated risks are higher than at other locations. The risks are very low to low risk, which is the same risk as having x-rays or a medical scan. The risks are due to high levels of arsenic in the soil from the past operation of the Giant Mine.
Every different way that people come in contact with arsenic could not be studied, but the wide range of ways studied in the risk assessment showed that risks in the Yellowknife area are not different to what is shown in Figure 10. After the Giant Mine has been cleaned up, the risks shown in the figure will not be changed, as clean up at the Giant Mine will not change the arsenic levels in soils across the Yellowknife area. The risk assessment was careful and over stated the exposures, so the risks may be lower than shown in the figure.
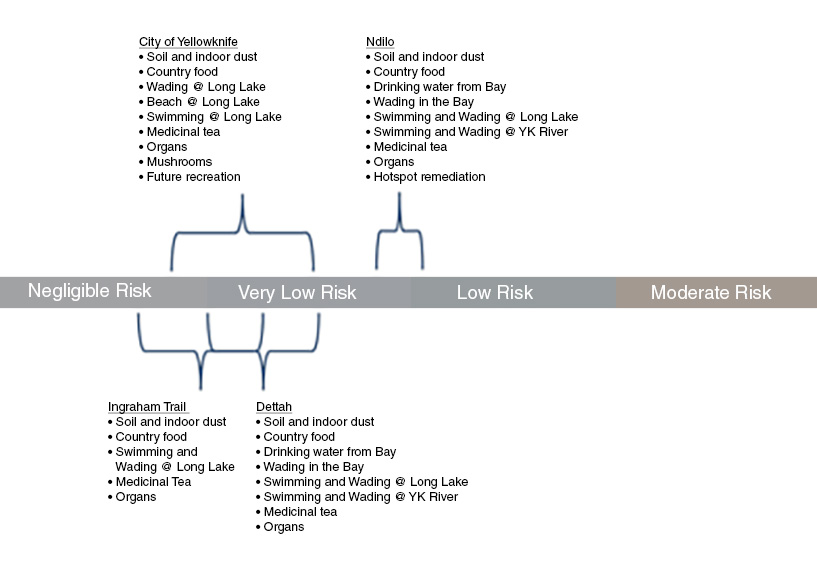
Description of Figure 10: Summary of results of the HHRA
Figure 10 shows a line to demonstrate if the level of risk is negligible, very low, low, or moderate at different areas around Yellowknife. In the City of Yellowknife, there are negligible to very low risks from soil and indoor dust, country food, wading at Long Lake, the beach at Long Lake, swimming at Long Lake, medicinal tea, organs, mushrooms, and future recreational activities. For the Ingraham Trail, there are negligible to very low risks from soil and indoor dust, swimming and wading at Long Lake, medicinal teas and organs. In Dettah, there are negligible to very low risks from soil and indoor dust, country food, drinking water from the Bay, swimming and wading at Long Lake, swimming and wading in the Yellowknife River, medicinal tea and organs. In Ndilo, there are very low risks to low risks from soil and indoor dust, country food, drinking water from the Bay, wading in the Bay, swimming and wading at Long Lake, swimming and wading in the Yellowknife River, medicinal tea, organs, and hotspot remediation.
Right now the Giant Mine is fenced and people cannot go on the site. In the future, after clean up of the Giant Mine, some people have said that they would like to hike, walk, or run on certain areas of the site. These activities will not result in any increase in risk. Members of the YKDFN have said that they do not want to use the site in the future. At the former Townsite, the soil will be cleaned up to the GNWT residential value while the sediments close to the shore will be cleaned up to background levels. In the future, if people were to live in the former Townsite area, the risks would be similar to those for people living in the City of Yellowknife or Dettah.
As the risks in Ndilo are higher than in other areas, a plan to clean up the soils should be considered for the community. Additional soil sampling should be carried out at Latham Island and the Townsite area after clean up to find out whether the levels in the soil are similar to those used in the risk assessment.
Ecological Risk Assessment
What plants and animals were considered?
A number of different animals were included, such as small animals like mice that spend all their time on the site and larger animals like a lynx or fox that could move across the Giant Mine. Very large animals such as moose, caribou, and bear were not studied as the Giant Mine is only a small part of the area they use, and studies done before found that they were not at risk. Plants that grow on the site were also studied. Fish, water plants, insects, and small animals (muskrat, mink) that are present in Baker Creek were studied (Figure 11).
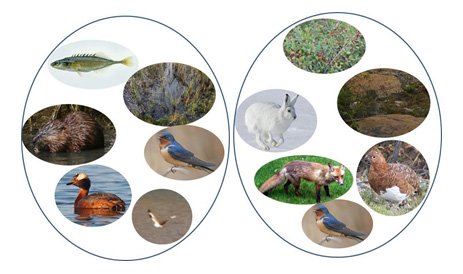
Description of Figure 11: Examples from the ERA of who is exposed
Figure 11 shows image examples from the Ecological Risk Assessment of what might be exposed to contaminants. Images include small fish, beavers, songbirds, waterfowl, water, berries, rabbits, fox, ptarmigan, and lichen.
What are the results of the ERA?
There are high levels of arsenic in the sediments of Yellowknife Bay close to the Giant Mine and these are expected to go down slowly over time.
Right now there are some effects on fish and insects that live in the sediments in Baker Creek but things will get better once the clean up in the creek is done. Moving the treatment plant pipe to the mouth of Baker Creek will change the flow in Baker Creek and it may be dry during the summer months.
After the clean up things will get better on the Giant Mine but small animals may still have some effects.