Archived - Quarterly Financial Report for the quarter ended December 31st, 2016 - Revised
Archived information
This Web page has been archived on the Web. Archived information is provided for reference, research or record keeping purposes. It is not subject to the Government of Canada Web Standards and has not been altered or updated since it was archived. Please contact us to request a format other than those available.
Date: April 18, 2017
Location: Departmental budgetary Expenditures by Standard Object (unaudited)
Revision:
10 Transfer payments; Planned expenditures for the year ending March 31, 2016*; 7,127,617 replaced by 7,127,767
Rationale: Transcription error
Table of contents
1. Introduction
This quarterly financial report has been prepared by management as required by section 65.1 of the Financial Administration Act and in the form and manner prescribed by the Treasury Board. It should be read in conjunction with the Main Estimates, Supplementary Estimates (A) and (B) for fiscal year 2016-2017. For purposes of the Main Estimates and Supplementary Estimates, the Department is referred to as Indian Affairs and Northern Development.
The quarterly financial report has not been subject to an external audit or review.
1.1 Authority, Mandate and Program Activities
Indigenous and Northern Affairs Canada (INAC) supports Indigenous people (First Nations, Inuit and Métis) and Northerners in their efforts to:
- Improve social well-being and economic prosperity;
- Develop healthier, more sustainable communities; and
- Participate more fully in Canada's political, social and economic development – to the benefit of all Canadians.
Further details on INAC's authority, mandate and program activities can be found in Part II of the Main Estimates and the Report on Plan and Priorities.
1.2 Basis of Presentation
This quarterly report has been prepared by management using an expenditure basis of accounting and a special purpose financial reporting framework designed to meet financial information needs with respect to the use of spending authorities. The accompanying Statement of Authorities includes INAC's spending authorities granted by Parliament and those used by the Department consistent with the Main Estimates and Supplementary Estimates (A) and (B) as well as budget adjustments approved by Treasury board for fiscal year 2016-2017.
The authority of Parliament is required before monies can be spent by the Government. Approvals are given in the form of annually approved limits through appropriation acts or through legislation in the form of statutory spending authority for specific purposes. The Department uses the full accrual method of accounting to prepare and present its annual departmental financial statements that are part of the departmental performance reporting process. However, the spending authorities voted by Parliament remain on an expenditure basis.
1.3 INAC's (Indigenous and Northern Affairs Canada) Financial Structure
The parliamentary vote structure of INAC is made up of $9.4 billion in budgetary authorities of which $9.2 billion requires approval by Parliament; referred to as voted amounts. The remaining $165.5 million represents statutory authorities that do not require additional approval and are provided for information purposes.
Voted amounts totaling $9.2 billion are split between Operating Expenditures, Capital Expenditures and Grants and Contributions as follows:
- Operating Expenditures represents approximately $1.0 billion (11%) which includes regular operating funding for salary and non-salary expenditures as well as $218.3 million (22% of Operating Expenditures) for the Settlement Allotment (Independent Assessment Process and Alternative Dispute Resolution), $140.8 million (14% of Operating Expenditures) for the assessment, management and remediation of federal contaminated sites, and $110.1 million of comprehensive, specific and other claims (11% of Operating Expenditures), $68.6 million of Infrastructure funds (7% of Operating Expenditures)
- Capital represents approximately $55.4 million (1%)
- Grants and Contributions represent approximately $8.2 billion (88%)
More detailed information about INAC's financial structure, including information about the fiscal cycle, cost drivers, expenditure trends, etc. can be found online on the Financial information web page.
2. Highlights of fiscal quarter and fiscal year to date (YTD) results
This section highlights the significant items that contributed to the net increase or decrease in resources available for the year and actual expenditures for the quarter ended December 31st, 2016. Changes under 5% would have minimal impact on interpretation of results and therefore are not included in the explanation of variances.
2.1 Statement of Authorities (Table 1a and Table 1b)
The Quarterly Financial Report reflects the year over year change in authorities for the period April 1st to December 31st, 2016. Total year-to-date authorities available for use in the third quarter of 2016-17 were $9,442.1 million compared to $8,695.1 million for the same quarter of the prior year, representing a net increase in Departmental authorities of $747.0 million. This increase over 2015-2016 can be explained as follows:
| Programs | Changes in Authorities Available For Use ($ millions) - Quarter 1, 2 and 3 2015-16 versus Quarter 1, 2 and 3 2016-17 | |||||||
|---|---|---|---|---|---|---|---|---|
| Budgetary | Non-Budgetary | Total | ||||||
| Vote 1 Operating | Vote 5 Capital | Vote 10 Grants and Contributions | Statutory - Operating | Statutory – Grants and Contributions | ||||
| Increase; | ||||||||
| a | Funding for the repair and construction of on-reserve schools; Funding for affordable housing and social infrastructure projects; Funding for the construction of public infrastructure on reserve; Funding for First Nations Enhances Education Infrastructure Fund; Funding for waste management; Funding for First Nations water, wastewater management; Funding for Inuit housing investments in Nunavik, Nunatsiavut and the Inuvialuit region |
35.9 | 638.6 | 2.5 | 677.0 | |||
| b | Funding to support the First Nations Student Success Program and the Education Partnerships Program; Funding for additional investments in First Nations elementary and secondary education; Funding to support First Nations and Inuit Youth through the First Nations and Inuit Youth Employment Strategy - Skills Link Program |
2.1 | 321.8 | 0.2 | 324.0 | |||
| c | Funding to meet increased demand for ongoing Indian and Inuit Programs which reflects an allowance for inflation and population growth and provides access to basic services such as education, housing, community infrastructure (water and sewage systems), and social support services | 0.3 | 106.7 | 107.0 | ||||
| d | Funding to support urgent investments in the First Nations Child and Family Services Programs; Funding for the Family Violence Prevention Program; Funding to implement interim federal policy reforms to Jordan's principle under a child-first initiative | 0.8 | 75.2 | 0.1 | 76.0 | |||
| e | Funding for the assessment, management and remediation of federal contaminated sites | 27.0 | 41.8 | 0.4 | 69.1 | |||
| f | Funding for Indigenous Childhood Claims Litigations | 53.0 | 53.0 | |||||
| g | Funding to renew the Urban Aboriginal Strategy | 23.7 | 23.7 | |||||
| h | Funding for the pro-active reconciliation and management of Métis aboriginal rights and the management of Métis and non-status Indian litigation and funding to support economic development for the Métis Nation | 5.0 | 16.0 | 0.1 | 21.1 | |||
| i | Other various initiatives (net) ** | -3.6 | 0.1 | 16.1 | 3.2 | 1.3 | 17.4 | |
| j | Funding to support engagement with indigenous peoples through Indigenous Representative Organizations | 16.0 | 16.0 | |||||
| k | Funding to expand the Nutrition North Canada Program to support all northern isolated communities | 1.3 | 12.1 | 0.1 | 13.5 | |||
| l | Funding to strengthen the First Nations finance authority's capital base to support First Nations' access to capital markets | 10.0 | 10.0 | |||||
| m | Funding to support northern programs as part of the horizontal framework for clean growth and climate change | 3.6 | 5.0 | 0.4 | 9.1 | |||
| n | Funding to implement components of an effective government-wide approach to strengthen modern treaty implementation | 3.0 | 0.3 | 3.3 | ||||
| Sub-total Increase | 128.3 | 0.1 | 1,283.1 | 7.3 | 1.3 | 0.0 | 1,420.2 | |
| Decrease; | ||||||||
| o | Cash flow for the negotiation, settlement and implementation of specific, comprehensive and land claims | -249.7 | -108.3 | -0.1 | 11.7 | -14.0 | -360.3 | |
| p | Funding for the Indian Residential Schools Settlement Agreement including funding for awards to claimants resulting from the Independent Assessment Process and Alternative Dispute Resolution, funding for the administration and research required to support the federal government’s obligations under the agreement as well as funding related to the Indian Residential Schools Truth and Reconciliation Commission | -239.0 | 0.3 | 0.8 | -0.4 | -238.3 | ||
| q | Funding for Operation Return Home Manitoba Interlake Flood | -40.6 | -40.6 | |||||
| r | Transfer Canadian Heritage – To transfer the control and supervision of Aboriginal Friendship Centres, Cultural Connections for Aboriginal Youth, and Young Canada Works for Urban Aboriginal Youth as a result of government restructuring | -0.8 | -22.7 | -0.2 | -23.7 | |||
| s | Budget carry forward*** | -5.5 | -1.7 | -7.1 | ||||
| t | Funding for the construction of the Canadian High Arctic Research Station and the implementation of the Associated Science and Technology Program and transfer to Polar Knowledge Canada | 0.5 | -1.0 | -2.1 | -0.5 | -3.2 | ||
| Sub-total Decrease | -494.4 | -2.3 | -173.0 | -1.2 | 11.7 | -14.0 | -673.2 | |
| Total Qtr 1, Qtr 2 and Qtr 3 | Total net increase to Departmental Authorities | -366.1 | -2.2 | 1,110.1 | 6.1 | 13.1 | -14.0 | 747.0 |
| **e.g. (example). Other - Includes funding for Indspire to support post-secondary education for First Nations and Inuit students, funding for the expansion of the First Nations Land Management Regime and funding from the new Building Canada Fund to support investments through the First Nations Infrastructure Fund, funding for informatics enhancements to support the regulation of oil and gas development on First Nations reserve lands, funding for Land management to Sioux Valley Dakota Nation, Labrador Inuit Settlements and transfers between organizations. | ||||||||
| *** Department are permitted to carry forward up to 5% of Main Estimates Operating Budget and 20% of Capital Budgets | ||||||||
| Note: Figures may not add due to rounding | ||||||||
As shown in the table above, the $747.0 million increase in total authorities is primarily attributed to the net effect of the increase of $1,110.1 million in Grants and Contributions authority and $5.2 million for Statutory and Non-Budgetary Items to the decrease of $368.3 million in Operating and Capital. The high variance could be explained by two major factors; the Department has received a significant amount of funds related to Budget 2016 and there was no Supplementary Estimates B in 2015-16.
- The net increase of $1,110.1 million in Grants and Contributions authority is primarily due to an increase in funding for Infrastructure ($638.6M), the funding to support Education programs ($321.8M), the funding of an allowance for inflation and population growth ($106.7M), the funding to support Social programs ($75.2M), the funding for the assessment, management and remediation of federal contaminated sites ($41.8M), the funding of Urban Aboriginal Strategy ($23.7M), the funding to support Métis Aboriginal Rights and economic development for the Métis Nation plus the management of Métis and non-status Indian Litigation ($16.0M), the funding to support engagement with indigenous peoples through Indigenous Representative Organizations ($16.0M), the funding to expand the Nutrition North Canada program ($12.1M), the funding to support First Nations' access to capital markets ($10.0M), the funding to support northern program for clean growth and climate change ($5.0M) and other various initiatives ($16.9M). This is offset by the decrease of the cash flow for the negotiation, settlement and implementation of specific and comprehensive claims ($108.3M), the funding for the Operation Return Home Manitoba Interlake Flood ($40.6M), the transfer of funding for Aboriginal Friendship Centers, Cultural Connections for Aboriginal Youth, and Young Canada Works for Urban Aboriginal Youth ($22.7M) and the construction of the Canadian High Arctic Research Station ($2.1M).
- The $5.2 million increase in Statutory and Non budgetary items consists of a net effect of the decrease for the negotiation, implementation of specific, comprehensive and land claims ($2.3M) and the increase of miscellaneous items such as the employee benefits plan ($7.5M).
- The net decrease of $368.3 million in Operating and Capital authority (Vote 1 and Vote 5) is primarily due to the decrease of funding for cash flow for the negotiation, settlement and implementation of specific, comprehensive and land claims ($249.7M), the decrease in funding for the Indian Residential Schools Settlement Agreement and related funding for the Indian Residential Schools Truth and Reconciliation Commission ($239.0), for the Operating and Capital Budget Carry forward ($7.1M). This is offset by the increase of the funding for Indigenous Childhood Claims Litigations ($53.0M), funding to support Infrastructure ($35.9M), the funding for the assessment, management and remediation of federal contaminated sites ($27.0M) and other initiatives ($11.6M).
2.2 Statement of Departmental Budgetary Expenditures by Standard Object (Table 2)
Highlights of Fiscal Quarter ended September 30th, 2016
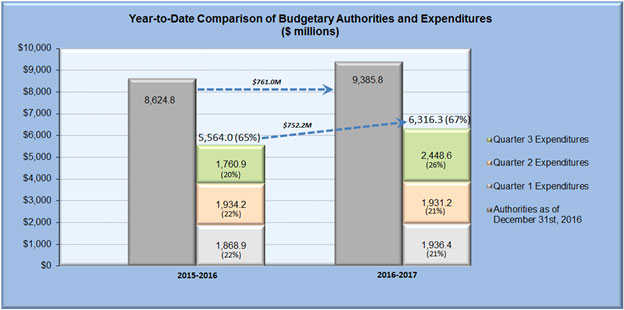
The Department is estimating budgetary expenditures of $9.4 billion in 2016-2017. In the third quarter, budgetary authorities were $761.0 million higher and departmental expenditures were $752.2 million higher than the same period in 2015-2016. 67% of total available budgetary authorities were expended which is similar to previous year third quarter with 65%.
Text description of the above chart
This image is of a bar graph of the year-to-date comparison of budgetary authorities and expenditures as of the end of December 31st, 2016. The graph plots the authorities and expenditures by quarter arriving at a year to date total for the fiscal years 2015-16 and 2016-17.
Authorities include the Main Estimates, Supplementary Estimates A and B plus items from the Allotment listings such as the Operating and Capital budget carry forward as of December 31st, 2016. Authorities for 2015-16 are $8,624.8 million and $9,385.8 million for 2016-17. The net difference is an increase of $761.0 million.
Expenditures for 2015-16 Q3 are $1,760.9 million and $2,448.6 million for 2016-17. At the end of Q3, total expenditures are at $5,564.0 million in 2015-16 compared to $6,316.3 million in 2016-17. The result is a net increase of $752.2 million.
In table 2, the net increase of $752.2 million in expenditures is mainly due to funds expended for Transfer payments ($687.7M) (Standard Object 10). The largest increases were observed under Infrastructure projects, Education programs, such as Elementary and Secondary Services, and Social programs, such as Child and Family Services. This increase can be explained by the fact that the Department has received substantial funding related to Budget 2016 for these programs. Finally, there is also an increase in Other subsidies and payments (Standard Object 12) which is offset by the decrease of Professional and special services (Standard Object 4) and Acquisition of land, building and works (Standard Object 8).
3. Risks and Uncertainties
3.1 Risks and Uncertainties
Risk management and risk-based decision-making have become a critical component in the way the Department prioritizes and conducts its business. Resource allocation decisions are informed by risk and the Department's key corporate risks are discussed systematically by the senior management committee, which contributes to the better allocation of resources and ultimately better results.
The Department continues to monitor its risk exposure and take action as needed to mitigate the risk of not achieving anticipated outcomes or to deal with emerging pressures. Achievement of INAC's strategic outcomes and delivery of programs is dependent on timely access to appropriate authorities and funding levels.
In terms of transfer payment program and transfer payment recipient risk, the Department transfers in excess of $8 billion dollars to recipients each year, while balancing program and recipient risks to deliver on its mandate. The Department undertakes risk assessments on new, existing and reformed programs as well as an annual General Assessment of each recipient to identify certain areas at risk as history has substantiated a link between risk level and default prevention.
3.2 Risk Mitigating Strategies
Corporate and financial risk mitigation activities, reflected in the Department's Corporate Risk Profile, are monitored by senior management on a semi-annual basis and modified as required. A number of practices and internal controls help to manage risk departmentally, including senior management governance and oversight as established through committees, existing policies and procedures that ensure an appropriate level of monitoring, review and reporting.
The Department is managing its budget by aligning resources to needs and through rigorous monitoring against both financial and human resource targets. Management proactively and systematically manages and responds to risks to minimize adverse impacts and capitalize on opportunities. Budget and expenditure trends are monitored regularly, including a review and challenge function, through the Financial Status Report.
Budget 2016 announced $8.4 billion over five years to improve the socio-economic conditions of Indigenous peoples and their communities. In 2016-17 INAC will receive $1.2 billion, and a large portion of these funds, $732 million, are for infrastructure programming and represents a 64 % percent increase in the infrastructure budget. In order to strengthen controls in this area, a review of the management control framework for the Capital Facilities and Maintenance Program (CFMP) was conducted and improvements made such as the introduction of a new due diligence checklist which focuses management's attention on key management controls and the development of an infrastructure-focused project audit regime. The Program is also currently undergoing a comprehensive risk assessment to ensure current and future risks are identified, assessed and mitigated. Findings resulting from ongoing departmental audits, evaluations and reviews, are being identified as actions within the infrastructure compliance framework.
Following an assessment of fraud risk conducted in 2014, the Department is implementing a fraud risk mitigation plan to address the identified risks.
In order to ensure effective controls, transparency and accountability, a risk-based approach is used to confirm that recipients have met planned program outcomes and results; that they are in compliance with funding agreements; and, that the funds were used to the intended purposes. In addition, the ability to conduct audits of recipients, under the terms of their funding agreements; provide a further opportunity to ensure that First Nations have appropriate management, financial and administrative controls in place.4. Significant changes in relation to Operations, Personnel and Programs
Over the last few years, the Settlement Agreement Branch, Resolution and Individual Affairs Sector (RIA), has gone through various waves of transition as part of the planned sun-setting of the Indian Residential Schools Settlement Agreement (IRSSA). As the completion of activities related to the implementation of the Settlement Agreement approaches, operations in the Vancouver office will be ceasing.
5. Approval by Senior Officials
Approved, as required by the Treasury Board Policy on Financial Resource Management, Information and Reporting:
Original signed by
_________________________
Hélène Laurendeau
Deputy Minister
Date: February 28, 2016
City: Gatineau (Canada)
Original signed by
_________________________
Paul J. Thoppil, CPA, CA
Chief Financial Officer
Date: February 24, 2016
City: Gatineau (Canada)
| Fiscal year 2016-2017 | Fiscal year 2015-2016 (1) | Variances | ||||||||
|---|---|---|---|---|---|---|---|---|---|---|
| Vote | Total available for use for the year ending March 31, 2017 * | Used during the quarter ended December 31, 2016 | Year to date used at quarter-end | Total available for use for the year ending March 31, 2016 * | Used during the quarter ended December 31, 2015 | Year to date used at quarter-end | Authority | Qtr | YTD | |
| * Including only Authorities available for use and granted by Parliament at quarter-end. (1) Figures may differ from 2015-16 report due to rounding |
||||||||||
| 1 | Operating expenditures | 1,009,734 | 242,173 | 630,125 | 1,375,857 | 231,396 | 969,838 | -366,123 | 10,777 | -339,713 |
| 5 | Capital expenditures | 55,426 | 14,320 | 29,131 | 57,603 | 31,274 | 50,197 | -2,177 | -16,954 | -21,066 |
| 10 | Grants and contributions | 8,155,197 | 2,145,408 | 5,533,554 | 7,045,047 | 1,466,488 | 4,439,623 | 1,110,150 | 678,920 | 1,093,931 |
| (S) | Budgetary statutory authorities - Operating Expenditures: | |||||||||
| Contributions to employee benefit plans | 65,035 | 13,182 | 39,545 | 58,826 | 14,678 | 44,033 | 6,209 | -1,496 | -4,488 | |
| Minister of Indigenous and Northern Affairs – Salary and motor car allowance | 84 | 21 | 42 | 82 | 8 | 49 | 2 | 13 | -7 | |
| Payments to comprehensive claim beneficiaries in compensation for resource royalties | 2,544 | - | - | 2,638 | 508 | 508 | -94 | -508 | -508 | |
| Liabilities in respect of loan guarantees made to Indians for Housing and Economic Development | 2,000 | - | - | 2,000 | - | 2,156 | - | - | -2,156 | |
| Grassy Narrows and Islington Bands Mercury Disability Board | 15 | - | - | 15 | - | - | - | - | - | |
| Other | - | 8,150 | 9,235 | - | 61 | 2,209 | - | 8,089 | 7,026 | |
| (S) | Budgetary statutory authorities - Transfer Payments: | |||||||||
| Grants to Aboriginal organizations designated to receive claim settlement payments pursuant to Comprehensive Land Claim Settlement Acts | 66,317 | 13,428 | 57,817 | 54,589 | 4,524 | 36,175 | 11,728 | 8,904 | 21,642 | |
| Grant to the Nunatsiavut Government for the implementation of the Labrador Inuit Land Claims Agreement pursuant to the Labrador Inuit Land Claims Agreement Act | - | - | - | - | 4,731 | 4,731 | - | -4,731 | -4,731 | |
| Indian Annuities Treaty payments | 1,400 | 36 | 2,459 | 1,400 | 37 | 2,075 | - | -1 | 384 | |
| Contributions in connection with First Nations infrastructure | 28,067 | 11,895 | 14,367 | 26,731 | 7,249 | 12,449 | 1,336 | 4,646 | 1,918 | |
| Total Budgetary Authorities | 9,385,819 | 2,448,613 | 6,316,275 | 8,624,788 | 1,760,954 | 5,564,043 | 761,031 | 687,659 | 752,232 | |
| Non-Budgetary Authorities: | ||||||||||
| Loans to native claimants | 25,903 | 3,769 | 13,047 | 39,903 | 5,819 | 13,304 | -14,000 | -2,050 | -257 | |
| Loans to First Nations in British Columbia | 30,400 | 5,063 | 12,610 | 30,400 | 6,461 | 12,949 | - | -1,398 | -339 | |
| Total Non-Budgetary Authorities | 56,303 | 8,832 | 25,657 | 70,303 | 12,280 | 26,253 | -14,000 | -3,448 | -596 | |
| Total Authorities | 9,442,122 | 2,457,445 | 6,341,932 | 8,695,091 | 1,773,234 | 5,590,296 | 747,031 | 684,211 | 751,636 | |
| Fiscal year 2016-2017 | Fiscal year 2015-2016 (1) | Variances | |||||||
|---|---|---|---|---|---|---|---|---|---|
| Expenditures: | Planned expenditures for the year ending March 31, 2017* | Expended during the quarter ended December 31st, 2016 | Year to date used at quarter-end | Planned expenditures for the year ending March 31, 2016* | Expended during the quarter ended December 31st, 2015 | Year to date used at quarter-end | Planned | Qtr | YTD |
| * Including only Authorities available for use and granted by Parliament at quarter-end. (1) Number may differ from 2015-16 report due to rounding |
|||||||||
| 1 Personnel | 435,111 | 107,017 | 313,318 | 413,317 | 103,940 | 315,645 | 21,794 | 3,077 | -2,327 |
| 2 Transportation and communications | 62,694 | 6,681 | 15,643 | 29,528 | 6,408 | 16,316 | 33,166 | 273 | -673 |
| 3 Information | 27,947 | 1,463 | 3,479 | 14,598 | 1,619 | 4,102 | 13,349 | -156 | -623 |
| 4 Professional and special services | 271,047 | 50,382 | 157,197 | 323,982 | 84,780 | 140,750 | -52,935 | -34,398 | 16,447 |
| 5 Rentals | 34,682 | 4,252 | 8,613 | 14,659 | 4,307 | 6,916 | 20,023 | -55 | 1,697 |
| 6 Purchased repair and maintenance | 7,776 | 261 | 678 | 2,759 | 298 | 627 | 5,017 | -37 | 51 |
| 7 Utilities, materials and supplies | 9,374 | 822 | 1,868 | 5,907 | 594 | 1,641 | 3,467 | 228 | 227 |
| 8 Acquisition of land, buildings and works | 51,308 | 13,313 | 27,285 | 51,997 | 29,531 | 47,163 | -689 | -16,218 | -19,878 |
| 9 Acquisition of machinery and equipment | 3,305 | 1,045 | 1,945 | 399 | 466 | 890 | 2,906 | 579 | 1,055 |
| 10 Transfer payments | 8,250,981 | 2,170,766 | 5,608,198 | 7,127,767 | 1,483,029 | 4,495,054 | 1,123,214 | 687,737 | 1,113,144 |
| 11 Public debt charges | - | - | - | - | - | - | - | - | - |
| 12 Other subsidies and payments | 232,304 | 92,894 | 178,851 | 640,585 | 45,982 | 534,939 | -408,281 | 46,912 | -356,088 |
| Total gross budgetary expenditures | 9,386,529 | 2,448,896 | 6,317,075 | 8,625,498 | 1,760,954 | 5,564,043 | 761,031 | 687,942 | 753,032 |
| Less: Revenues netted against expenditures | |||||||||
| Internal Services | -710 | -283 | -800 | -710 | - | - | - | -283 | -800 |
| Total Revenues netted against expenditures | -710 | -283 | -800 | -710 | - | - | - | -283 | -800 |
| Total net budgetary expenditures | 9,385,819 | 2,448,613 | 6,316,275 | 8,624,788 | 1,760,954 | 5,564,043 | 761,031 | 687,659 | 752,232 |