Archived - Quarterly Financial Report for the quarter ended December 31, 2015
Archived information
This Web page has been archived on the Web. Archived information is provided for reference, research or record keeping purposes. It is not subject to the Government of Canada Web Standards and has not been altered or updated since it was archived. Please contact us to request a format other than those available.
Introduction
This quarterly financial report has been prepared by management as required by section 65.1 of the Financial Administration Act and in the form and manner prescribed by the Treasury Board. It should be read in conjunction with the Main Estimates and Supplementary Estimates (A) for fiscal year 2015-2016. Given the timing of the dissolution and reconvening of Parliament, Supplementary Estimates (B), 2015–16 has been limited to items for which specific authority through the appropriation act is required before March 2016 and which could not be funded through existing appropriations. INAC didn't present such items, therefore, does not have Supplementary Estimates B. For purposes of both the Main and Supplementary Estimates, the Department is referred to as Indian Affairs and Northern Development.
The quarterly financial report has not been subject to an external audit or review.
1.1 Authority, Mandate and Program Activities
Indigenous and Northern Affairs Canada (INAC) supports Indigenous people (First Nations, Inuit and Métis) and Northerners in their efforts to:
- Improve social well-being and economic prosperity;
- Develop healthier, more sustainable communities; and
- Participate more fully in Canada's political, social and economic development – to the benefit of all Canadians.
Further details on INAC's authority, mandate and program activities can be found in Part II of the Main Estimates and the Report on Plans and Priorities.
1.2 Basis of Presentation
This quarterly report has been prepared by management using an expenditure basis of accounting and a special purpose financial reporting framework designed to meet financial information needs with respect to the use of spending authorities. The accompanying Statement of Authorities includes INAC's spending authorities granted by Parliament and those used by the Department consistent with the Main Estimates and Supplementary Estimates (A) and Allotment adjustments such as Operating Carry Forward and Capital Carry Forward for the 2015-2016 fiscal year.
The authority of Parliament is required before monies can be spent by the Government. Approvals are given in the form of annually approved limits through appropriation acts or through legislation in the form of statutory spending authority for specific purposes.
The Department uses the full accrual method of accounting to prepare and present its annual departmental financial statements that are part of the departmental performance reporting process. However, the spending authorities voted by Parliament remain on an expenditure basis.
1.3 INAC's Financial Structure
The parliamentary vote structure of INAC is made up of $8.6 billion in budgetary authorities of which $8.5 billion requires approval by Parliament; referred to as voted amounts. The remaining $146.3 million represents statutory authorities that do not require additional approval and are provided for information purposes.
Voted amounts totaling $8.5 billion are split between Operating Expenditures, Capital Expenditures and Grants and Contributions as follows:
- Operating Expenditures represent approximately $1.4 billion (16%), this includes $365.2 million (27% of Operating Expenditures) for the Settlement Allotment (Independent Assessment Process and Alternative Dispute Resolution), $255.5 million for one year funding out-of-court settlements (19% of Operating Expenditures) $105.2 million (8% of Operating Expenditures) for the assessment, management and remediation of federal contaminated sites.
- Capital represents approximately $57.6 million (1%)
- Grants and Contributions represent approximately $7.0 billion (83%)
More detailed information about INAC's financial structure, including information about the fiscal cycle, cost drivers, expenditure trends, etc. can be found online on the Financial Overview page.
2. Highlights of fiscal quarter and fiscal year to date (YTD) results
This section highlights the significant items that contributed to the net increase or decrease in resources available for the year and actual expenditures for the quarter ended December 31st, 2015. The explanation of variances considers that changes under 5% would have minimal impact on interpretation of results.
2.1 Statement of Authorities (Table1)
The Quarterly Financial Report reflects the year over year change in authorities for the period April 1st to December 31st, 2015. Total year-to-date authorities available for use in the third quarter of 2015-2016 were $8,695 million compared to $8,641 million for the same quarter of the prior year, representing an increase in Departmental authorities of $54.0 million. The total 2015-2016 year-to-date authority increase of $54.0 million over 2014-2015 can be explained as follows:
| Program | Changes in Authorities Available For Use ($ millions) Quarter 1 to Quarter 3 2015-16 versus Quarter 1 to Quarter 3 2014-15 |
||||||
|---|---|---|---|---|---|---|---|
| Budgetary | Non-Budgetary | Total | |||||
| Vote 1 Operating |
Vote 5 Capital |
Vote 10 Grants and Contributions |
Statutory - Operating |
Statutory – Grants and Contributions |
|||
| Increase | |||||||
| a. Cash flow for the negotiation, settlement and implementation of specific and comprehensive claims (primarily for the settlement of litigation filed in 2006 by an Inuit organization against Canada) | 253.0 | 18.8 | (30.0) | 241.8 | |||
| b. Funding to meet increased demand for ongoing Indian and Inuit programs which reflects a 2% allowance for inflation and population growth and provides access to basic services such as education, housing, community infrastructure (water and sewage systems), and social support services | 0.3 | 104.6 | 104.9 | ||||
| c. Funding to support the repair and construction of on-reserve schoolss | 50.0 | 50.0 | |||||
| d. Funding for the construction of the Canadian High Arctic Research Station and the implementation of the associated Science and Technology Program | 4.1 | 22.7 | 1.0 | 0.2 | 28.0 | ||
| e. Funding to advance a comprehensive and sustainable approach to Emergency Management on reserve | 32.3 | 32.3 | |||||
| f. Funding for the facilitation of Aboriginal participation in West Coast energy development | 6.8 | 6.8 | |||||
| g. Funding from the new Building Canada Fund to support investments through the First Nations Infrastructure Fund | 15.0 | 15.0 | |||||
| h. Funding for Déline First Nation Self-Government | 0.9 | 12.4 | 0.1 | 13.4 | |||
| i. Funding for Déline First Nation Self-Government | 1.0 | 1.0 | |||||
| Decrease | |||||||
| j. Funding to meet the Government of Canada`s obligations under the Northwest Territories Land and Resources Devolution Agreement | (29.4) | (9.0) | (3.0) | (41.4) | |||
| k. Funding primarily reflecting the sunset of targeted funding for initiatives to improve First Nations Education | (133.4) | (133.4) | |||||
| l. Funding for the Indian Residential Schools Settlement Agreement including funding for awards to claimants resulting from the Independent Assessment Process and Alternative Dispute Resolution, funding for the administration and research required to support the federal government's obligations under the agreement as well as funding related to the Indian Residential Schools Truth and Reconciliation Commission | (204.9) | (4.3) | (209.2) | ||||
| m. Budget Carry Forward* | (8.0) | (0.6) | (8.6) | ||||
| n. Canadian High Arctic Research Station - Deemed Appropriations for Polar Knowledge Canada ** | (6.3) | (1.7) | (8.0) | ||||
| o. Funding for the assessment, management and remediation of federal contaminated sites | (23.0) | (5.0) | (28.0) | ||||
| p. Funding to meet Canada's implementation obligations for Comprehensive Land Claims Agreements in Yukon, Northwest Territories and Quebec | (4.9) | (4.9) | |||||
| q. Internal transfer for the implementation of a common definition for the capital expenditures vote | 9.2 | (9.2) | 0.0 | ||||
| r. Other various initiatives (net) *** | (20.0) | (1.8) | 14.5 | 1.5 | (5.8) | ||
| 3rd Qtr **** Total increase / (decrease) to Departmental Authorities | (24.1) | 11.1 | 102.5 | (5.5) | (30.0) | 0.0 | 54.0 |
| * Department are permitted to carry forward up to 5% of Main Estimates Operating Budget and 20% of Capital Budgets. | |||||||
| ** Canadian High Arctic Research Station (CHARS) - Deemed appropriation: Transfer from INAC for the creation of Polar Knowledge Canada. | |||||||
| ***e.g. (example). Other - Initiatives include Self-Government agreements and Nutrition North Canada program; net decrease in funding for Federal Contaminated Sites, Métis Aboriginal rights and the management of Métis and non-status Indian litigation. Also includes out of court settlements, transfer to DND for Ipperwash, transfer to ESD for Kativik, Sioux Dakota Valley Nation and collective agreements. | |||||||
| **** Please note that the decrease to Departmental Authorities in the third quarter is mainly due to the absence of Supplementary Estimates B in 2015-16. | |||||||
- As shown in the table above, the $54.0 million increase in total authorities is primarily attributed to the increase of the Grants and Contributions authority.
- The year over year net decrease of $18.5 million in Operating authority (Operating Vote 1 Capital Vote 5, Statutory Operating) is due to the decrease in funding for the Indian Residential Schools Settlement Agreement and for the funding of Indian Residential Schools Truth and Reconciliation Commission ($204.9M), Northwest Territories Land and Resources Devolution Agreement ($29.4M), Management and remediation of federal contaminated sites ($23.0M), the Carry Forward ($8.0M in Vote 1 and $600K in Vote 5), the deemed appropriation to Polar Knowledge Canada for the Canadian High Arctic Research Station programming ($6.3M), and miscellaneous reduction in Vote 1 Operating and Vote 5 Capital ($20.0M Vote 1 and $1.8M Vote 5) and a net decrease in Statutory Operating ($5.5M). This decrease is offset by an increase of funding for claims related activities and settlement of litigation ($253.0M), Construction of the Canadian High Arctic Research Station Major Crown project ($4.1M in Vote 1 and $22.7M in Vote 5), consolidated Urban Aboriginal Strategy ($900K) and 2% allowance for inflation and population growth for ongoing Indian and Inuit Program ($300K).
- The year over year net increase of $72.4 million in Grants and Contributions authority is primarily due to an increase in funding for ongoing Indian and Inuit programs providing access to basic services ($104.6M), the repair and construction of schools on reserve across the country ($50M), Emergency Management on reserve ($32.3M), claim activities ($18.8M), First Nation infrastructure fund ($15.0M), Urban Aboriginal Strategy ($12.4M) West Coast energy development (net $6.8M), Déline First Nation Self Government ($1.0M), Canadian High Arctic Research Station ($1.0M), and other miscellaneous increase of $14.5M. The increase is offset by the decrease of targeted funding for initiatives to improve First Nation Education ($133.4M), the sunset of statutory funding for the Nisga'a Nation and the Labrador Inuit ($30.0M), Northwest Territories Devolution (net $9.0M), the assessment, management and remediation of federal contaminated sites ($5.0M), the decrease in funding to meet Canada's implementation obligations for Comprehensive Land Claims Agreements in Yukon, Northwest Territories and Quebec ($4.9M), and reduction of Canadian High Arctic Research Station deemed appropriation ($1.7M). Reduced funding within First Nation Education is being offset through the renewal of funding that has been accessed within the first quarter and through future Estimates process.
2.2 Statement of Departmental Budgetary Expenditures by Standard Object (Table 2)
Highlights of Fiscal Quarter ended December 31st, 2015
The Department is estimating budgetary expenditures of $8.6 billion in 2015-2016. In the third quarter, departmental expenditures were $6.9 million higher than the same period in 2014-2015. 20% of total available budgetary authorities were expended which is in line with the previous year third quarter. Year-to-date expenditures account for 64.5% of the total available authorities compared to 59.2% in the same period in 2014-15.
As indicated in table 2, the total increase in expenditure of $6.9 million can be attributed to an increase of $69.6 million in Grant and Contribution expenditures (Transfer payments – Standard Object 10), $29.5 million Acquisition of land, buildings and works (Standard Object 08) and $1 million of miscellaneous items. This increase is offset by reduced spending of $64.0 million in Other subsidies and payments (Standard Object 12), $20.9 million in Professional and special services (Standard Object 04), $4.5 million in Personnel (Standard Object 01), $1.9 million in Information (Standard Object 03), $1.4 million in Transportation and communications (Standard Object 02) and $0.4 million in various Other Operating expenditure (Standard Object 06, 07).
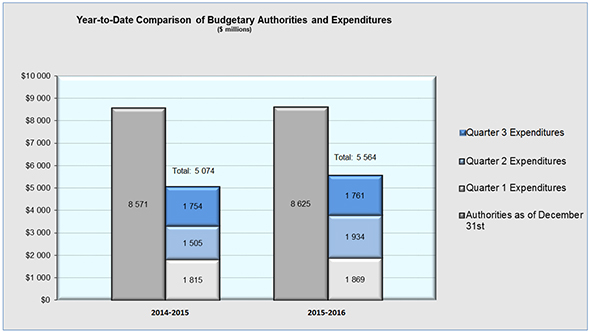
Text description of the above chart
This image is of a bar graph of the year-to-date comparison of budgetary authorities and expenditures as of the end of December 31st, 2015. The graph plots the authorities and expenditures by quarter arriving at a year to date total for the fiscal years 2014-2015 and 2015-2016.
The data shows the Q3 authorities equaling the Main Estimates, the Supplementary Estimates A and Allotment Adjustments such as Carry Forward arriving at the total authority at the end of Q3 for 2014-2015 of $8,571M and at $8,625M for 2015-16.
The net difference in comparing the authorities at the end of Q3 each fiscal year is an increase of $54.0M from 2014-2015 to 2015-2016.
The second column of each section of the graph pertains to expenditures. The 2014-2015 data shows the Q3 expenditures of $1,754M and 2015-2016 data shows $1 761M. The net difference in comparing the expenditures at the end of Q3 each fiscal year is an increase of $6.9M from 2014-15 to 2015-2016.
3. Risks and Uncertainties
3.1 Risks and Uncertainties
Risk management and risk-based decision-making have become a critical component in the way the Department prioritizes and conducts its business. Resource allocation decisions are informed by risk and the Department's key corporate risks are discussed systematically by the senior management committee, which contributes to the better allocation of resources and ultimately better results.
In terms of financial risk, the Department is operating in an environment of fiscal restraint in which the ability to reallocate resources internally is reduced. The Department continues to monitor its risk exposure and take action as needed to mitigate the risk of not achieving anticipated outcomes or to deal with emerging pressures. Achievement of INAC's strategic outcomes and delivery of programs is dependent on timely access to appropriate authorities and funding levels.
In terms of transfer payment program and transfer payment recipient risk, the Department transfers approximately $7 billion dollars to recipients each year, while balancing program and recipient risks to deliver on its mandate. The Department undertakes risk assessments on new, existing and reformed programs as well as an annual General Assessment of each recipient to identify certain areas at risk as history has substantiated a link between risk level and default prevention.
3.2 Risk Mitigating Strategies
Corporate and financial risk mitigation activities, reflected in the Department's Corporate Risk Profile, are monitored by senior management on a semi-annual basis and modified as required. A number of practices and internal controls help to manage risk departmentally, including senior management governance and oversight as established through committees, existing policies and procedures that ensure an appropriate level of monitoring, review and reporting.
The Department is addressing reduced flexibility to its budget as a result of expenditure restraint measures by aligning resources to needs and through rigorous monitoring against both financial and human resource targets. Management proactively and systematically manages and responds to risks to minimize adverse impacts and capitalize on opportunities. For example, cost containment measures and expenditure trends are monitored regularly, including a review and challenge function, through the Financial Status Report.
In order to ensure effective controls, transparency and accountability, a risk-based approach is used to confirm that recipients have met planned program outcomes and results; that they are in compliance with funding agreements; and, that the funds were used to the intended purposes. In addition, the ability to conduct audits of recipients, under the terms of their funding agreements; provide a further opportunity to ensure that First Nations have appropriate management, financial and administrative controls in place.
4. Significant changes in relation to Operations, Personnel and Programs
Significant changes in relation to Operations, Personnel and Programs during the third quarter of fiscal year 2015-16 include:
- The Department has now a new title, Indigenous and Northern Affairs Canada (INAC). For legal purposes, the Department of Indian Affairs and Northern Development (DIAND) remains the official legal name of the Department as it is set out in legislation. Therefore it must be used for legal documents.
- Carolyn Bennett has been appointed by the Prime Minister as the new Minister of Indigenous and Northern Affairs Canada.
- Director General, Margaret Buist, has agreed to lead a Secretariat within the Department to work with the Departments of Justice Canada and Status of Women Canada, to consult with survivors, families and loved ones of victims, National Aboriginal Organizations, provinces and territories and other stakeholders to identify the best process related to the National Inquiry into Missing and Murdered Indigenous Women and Girls.
5. Approval by Senior Officials
Approved, as required by the Treasury Board Policy on Financial Resource Management, Information and Reporting:
Original signed by
_______________________
Colleen Sword
Deputy Minister
Date: February 29, 2016
City: Gatineau
Original signed by
_______________________
Paul J. Thoppil, CPA, CA
Chief Financial Officer
Date: February 25, 2016
City: Gatineau
| Fiscal year 2015-2016 | Fiscal year 2014-2015 | Variances | ||||||||
|---|---|---|---|---|---|---|---|---|---|---|
| Vote | (thousands of dollars) | Total available for use for the year ending March 31, 2016 * | Used during the quarter ended December 31, 2015 | Year to date used at quarter-end | Total available for use for the year ending March 31, 2015 * | Used during the quarter ended December 31, 2014 | Year to date used at quarter-end | Authority | Qtr | YTD |
| 1 | Operating expenditures | 1,375,857 | 231,396 | 969,838 | 1,399,987 | 320,064 | 797,472 | (24,130) | (88,667) | 172,366 |
| 5 | Capital expenditures | 57,603 | 31,274 | 50,197 | 46,442 | 3,506 | 10,155 | 11,161 | 27,768 | 40,042 |
| 10 | Grants and contributions | 7,045,047 | 1,466,488 | 4,439,623 | 6,942,508 | 1,382,705 | 4,124,667 | 102,539 | 83,783 | 314,956 |
| (S) | Budgetary statutory authorities - Operating Expenditures: | |||||||||
| Contributions to employee benefit plans | 58,826 | 14,678 | 44,033 | 64,373 | 15,324 | 45,973 | (5,547) | (646) | (1,940) | |
| Minister of Aboriginal Affairs and Northern Development – Salary and motor car allowance | 82 | 8 | 49 | 80 | 20 | 60 | 2 | (12) | (11) | |
| Payments to comprehensive claim beneficiaries in compensation for resource royalties | 2,638 | 508 | 508 | 2,622 | 3,486 | 16 | 508 | (2,978) | ||
| Liabilities in respect of loan guarantees made to Indians for Housing and Economic Development | 2,000 | 2,156 | 2,000 | 10 | 2,146 | |||||
| Grassy Narrows and Islington Bands Mercury Disability Board | 15 | 15 | ||||||||
| Other | 61 | 2,209 | 1,687 | 6,061 | (1,626) | (3,852) | ||||
| (S) | Budgetary statutory authorities - Transfer Payments: | |||||||||
| Grants to Aboriginal organizations designated to receive claim settlement payments pursuant to Comprehensive Land Claim Settlement Acts | 54,589 | 4,524 | 36,175 | 75,611 | 4,524 | 57,187 | (21,022) | (21,012) | ||
| Grant to the Nunatsiavut Government for the implementation of the Labrador Inuit Land Claims Agreement pursuant to the Labrador Inuit Land Claims Agreement Act | 4,731 | 4,731 | 8,994 | 18,358 | 18,358 | (8,994) | (13,627) | (13,627) | ||
| Indian Annuities Treaty payments | 1,400 | 37 | 2,075 | 1,400 | (136) | 2,228 | 173 | (153) | ||
| Contributions in connection with First Nations infrastructure | 26,731 | 7,249 | 12,449 | 26,731 | 8,009 | 8,467 | (760) | 3,982 | ||
| Total Budgetary Authorities | 8,624,787 | 1,760,955 | 5,564,044 | 8,570,762 | 1,754,061 | 5,074,124 | 54,025 | 6,894 | 489,920 | |
| Non-Budgetary Authorities: | ||||||||||
| Loans to native claimants | 39,903 | 5,819 | 13,304 | 39,903 | 4,977 | 11,376 | 842 | 1,928 | ||
| Loans to First Nations in British Columbia | 30,400 | 6,461 | 12,949 | 30,400 | 6,296 | 14,401 | 165 | (1,452) | ||
| Total Non-Budgetary Authorities | 70,303 | 12,279 | 26,254 | 70,303 | 11,273 | 25,777 | 1,006 | 477 | ||
| Total Authorities | 8,695,090 | 1,773,234 | 5,590,298 | 8,641,065 | 1,765,334 | 5,099,901 | 54,025 | 7,900 | 490,397 | |
| * Including only Authorities available for use and granted by Parliament at quarter-end. | ||||||||||
| (thousands of dollars) | Fiscal year 2015-2016 | Fiscal year 2014-2015 | Variances | ||||||
|---|---|---|---|---|---|---|---|---|---|
| Planned expenditures for the year ending March 31, 2016 | Expended during the quarter ended December 31, 2015 | Year to date used at quarter-end | Planned expenditures for the year ending March 31, 2015 | Expended during the quarter ended December 31, 2014 | Year to date used at quarter-end | Planned | Qtr | YTD | |
| Expenditures: | |||||||||
| 1 Personnel | 413,317 | 103,940 | 315,645 | 457,219 | 108,412 | 328,618 | (43,902) | (4,472) | (12,973) |
| 2 Transportation and communications | 29,527 | 6,408 | 16,316 | 45,707 | 7,819 | 16,284 | (16,180) | (1,411) | 32 |
| 3 Information | 14,598 | 1,619 | 4,102 | 21,985 | 3,562 | 6,789 | (7,387) | (1,943) | (2,687) |
| 4 Professional and special services | 323,982 | 84,780 | 140,750 | 374,127 | 105,725 | 166,066 | (50,145) | (20,945) | (25,316) |
| 5 Rentals | 14,659 | 4,307 | 6,916 | 20,805 | 3,456 | 6,735 | (6,146) | 851 | 181 |
| 6 Purchased repair and maintenance | 2,759 | 298 | 627 | 3,926 | 501 | 957 | (1,167) | (203) | (330) |
| 7 Utilities, materials and supplies | 5,907 | 594 | 1,641 | 9,514 | 799 | 1,776 | (3,607) | (205) | (135) |
| 8 Acquisition of land, buildings and works | 51,997 | 29,531 | 47,163 | 31,880 | 35 | 88 | 20,117 | 29,496 | 47,075 |
| 9 Acquisition of machinery and equipment | 399 | 466 | 890 | 12,156 | 352 | 813 | (11,758) | 114 | 77 |
| 10 Transfer payments | 7,127,767 | 1,483,029 | 4,495,054 | 7,055,243 | 1,413,460 | 4,210,907 | 72,523 | 69,569 | 284,147 |
| 11 Public debt charges | - | - | - | - | - | - | - | - | - |
| 12 Other subsidies and payments | 640,586 | 45,982 | 534,941 | 538,909 | 109,940 | 335,091 | 101,676 | (63,958) | 199,850 |
| Total gross budgetary expenditures | 8,625,497 | 1,760,955 | 5,564,044 | 8,571,472 | 1,754,061 | 5,074,124 | 54,025 | 6,894 | 489,920 |
| Less: Revenues netted against expenditures | |||||||||
| Internal Services | (710) | - | - | (710) | - | - | - | - | - |
| Total Revenues netted against expenditures | (710) | - | - | (710) | - | - | - | - | - |
| Total net budgetary expenditures | 8,624,787 | 1,760,955 | 5,564,044 | 8,570,762 | 1,754,061 | 5,074,124 | 54,025 | 6,894 | 489,920 |