Archived - Quarterly Financial Report for the quarter ended September 30, 2015 (Revised)
Archived information
This Web page has been archived on the Web. Archived information is provided for reference, research or record keeping purposes. It is not subject to the Government of Canada Web Standards and has not been altered or updated since it was archived. Please contact us to request a format other than those available.
ERRATUM
Date: March 2, 2016
Location: Statement of Authorities (Table 1) – Line q – Vote 10 Grants and Contributions
Revision: "1.0" replace by "0"
Location: Statement of Authorities (Table 1) – Line r – Vote 10 Grants and Contributions
Revision: "add line r"
Location: Departmental Budgetary Expenditures by Standard Object (unaudited) (Table 2) –
– Planned expenditures for the year ending March 31, 2016 – Expenditures 10
Revision: "7 126 617" replaced by "7 127 617"
Location: Departmental Budgetary Expenditures by Standard Object (unaudited) (Table 2) –
Expended during the quarter ended September 30, 2015 – Expenditures 10
Revision: "641 586" replaced by "640 586"
Location: Departmental Budgetary Expenditures by Standard Object (unaudited) (Table 2) –Total gross budgetary expenditures and Total net budgetary expenditures - Variances Planned
Revision: "1 406 322" replaced by "1 411 109"
Location: Departmental Budgetary Expenditures by Standard Object (unaudited) (Table 2) –
Expended during the quarter ended September 30, 2015 – Expenditures 12
Revision: "3 007 238" replaced by "3 012 025"
Location: Departmental Budgetary Expenditures by Standard Object (unaudited) (Table 2) –
Year to date used at quarter-end – Expenditures 10
Revision: "493 746" replaced by "488 960"
Location: Departmental Budgetary Expenditures by Standard Object (unaudited) (Table 2) –
Variances – Planned – Expenditures 10
Revision: "150 417" replaced by "151 417"
Location: Departmental Budgetary Expenditures by Standard Object (unaudited) (Table 2) –
Variances – Planned – Expenditures 12
Revision: "103 662" replaced by "102 662"
Location: Departmental Budgetary Expenditures by Standard Object (unaudited) (Table 2) –
Variances – Qtr – Expenditures 10
Revision: "217 468" replaced by "222 255"
Location: Departmental Budgetary Expenditures by Standard Object (unaudited) (Table 2) –
Variances – Qtr – Expenditures 12
Revision: "220 024" replaced by "215 237"
Location: Departmental Budgetary Expenditures by Standard Object (unaudited) (Table 2) –
Variances – YTD – Expenditures 10
Revision: "209 790" replaced by "214 577"
Location: Departmental Budgetary Expenditures by Standard Object (unaudited) (Table 2) –
Variances – YTD – Expenditures 12
Revision: "268 596" replaced by "263 810"
Rationale for the revision: Error of calculation
Date: December 14, 2015
Location: Statement of Authorities (Table 1) – Line n – Operating Budget Carry Forward – Statutory Operating
Revision: "-4.3" replace by "0"
Location: Statement of authorities (unaudited) (Table 1) – Operating expenditures – Total available for use for the year ending March 31, 2016
Revision: "1,357,857" replaced by "1,375,857"
Location: Statement of authorities (unaudited) (Table 1) – Total budgetary Authorities – Year to date used at quarter-end
Revision: "3,320,363" replaced by "3,320,063"
Location: Statement of authorities (unaudited) (Table 1) – Grants to Aboriginal organizations designated to receive claim settlement payments pursuant to Comprehensive Land Claim Settlement Acts – Variances Authority
Revision: " -21,012" replaced by "-21,022"
Location: Departmental Budgetary Expenditures by Standard Object (unaudited) (Table 2) –Total gross budgetary expenditures and Total net budgetary expenditures - Variances Planned
Revision: "204,558" replaced by "204,559"
Location: Departmental Budgetary Expenditures by Standard Object (unaudited) (Table 2) – Total net budgetary expenditures – Planned expenditures for the year ending March 31, 2016
Revision: "8,620,289" replaced by "8,620,290"
Rationale for the revision: Reporting transcription error and rounding
1.1 Authority, Mandate and Program Activities
Aboriginal Affairs and Northern Development Canada (AANDC) supports Aboriginal people (First Nations, Inuit and Métis) and Northerners in their efforts to:
- Improve social well-being and economic prosperity;
- Develop healthier, more sustainable communities; and
- Participate more fully in Canada's political, social and economic development – to the benefit of all Canadians.
Further details on AANDC's authority, mandate and program activities can be found in Part II of the Main Estimates and the Report on Plans and Priorities.
1.2 Basis of Presentation
This quarterly report has been prepared by management using an expenditure basis of accounting and a special purpose financial reporting framework designed to meet financial information needs with respect to the use of spending authorities. The accompanying Statement of Authorities includes AANDC's spending authorities granted by Parliament and those used by the Department consistent with the Main Estimates, Carry Forward, Capital Carry Forward and Supplementary Estimates (A) for the 2015-2016 fiscal year.
The authority of Parliament is required before monies can be spent by the Government. Approvals are given in the form of annually approved limits through appropriation acts or through legislation in the form of statutory spending authority for specific purposes.
The Department uses the full accrual method of accounting to prepare and present its annual departmental financial statements that are part of the departmental performance reporting process. However, the spending authorities voted by Parliament remain on an expenditure basis.
1.3 AANDC's Financial Structure
The parliamentary vote structure of AANDC is made up of $8.6 billion in budgetary authorities of which $8.5 billion requires approval by Parliament; referred to as voted amounts. The remaining $146.3 million represents statutory authorities that do not require additional approval and are provided for information purposes.
Voted amounts totaling $8.5 billion are split between Operating Expenditures, Capital Expenditures and Grants and Contributions as follows:
- Operating Expenditures represents approximately $1.4 billion (16%), this includes $365.2 million (27% of Operating Expenditures) for the Settlement Allotment (Independent Assessment Process and Alternative Dispute Resolution) and $105.2 million (8% of Operating Expenditures) for the assessment, management and remediation of federal contaminated sites.
- Capital represents approximately $53.3 million (1%)
- Grants and Contributions represent approximately $7.0 billion (82%)
More detailed information about AANDC's financial structure, including information about the fiscal cycle, cost drivers, expenditure trends, etc. can be found online on the Financial Overview page.
2. Highlights of fiscal quarter and fiscal year to date (YTD) results
This section highlights the significant items that contributed to the net increase or decrease in resources available for the year and actual expenditures for the quarter ended September 30, 2015. The explanation of variances considers that changes under 5% would have minimal impact on interpretation of results.
2.1 Statement of Authorities (Table1)
The Quarterly Financial Report reflects the year over year change in authorities for the period April 1st to September 30th, 2015. Total year-to-date authorities available for use in the second quarter of 2015-2016 were $8,690.5 million compared to $8,486.0 million for the same quarter of the prior year, representing an increase in Departmental authorities of $204.5 million. The total 2015-2016 year-to-date authority increase of $204.5 million over 2014-2015 can be explained as follows:
| Program | Year Over Year Increase / (Decrease) in Authorities Available For Use ($ millions) | ||||||
|---|---|---|---|---|---|---|---|
| Budgetary | Non-Budgetary | Total | |||||
| Vote 1 Operating |
Vote 5 Capital |
Vote 10 Grants and Contributions |
Statutory - Operating |
Statutory – Grants and Contributions |
|||
| a. Net increase in the cash flow for the negotiation, settlement and implementation of specific and comprehensive claims (primarily for the settlement of litigation filed in 2006 by an Inuit organization against Canada) | 253.0 | 18.8 | (30.0) | 241.8 | |||
| b. Increase in funding to meet increased demand for ongoing Indian and Inuit programs which reflects a 2% allowance for inflation and population growth and provides access to basic services such as education, housing, community infrastructure (water and sewage systems), and social support services | 0.3 | 104.6 | 104.9 | ||||
| c. Increase in funding to support the repair and construction of on-reserve schools | 50.0 | 50.0 | |||||
| d. Increase in funding for the construction of the Canadian High Arctic Research Station and the implementation of the associated Science and Technology Program | 10.6 | 25.9 | 12.7 | 0.7 | 49.9 | ||
| e. Increase in funding for Operation Return Home: Manitoba Interlake Flood Remediation and Settlement | 40.6 | 40.6 | |||||
| f. Increase in funding to advance a comprehensive and sustainable approach to Emergency Management on reserve | 32.3 | 32.3 | |||||
| g. Increase in funding for the facilitation of Aboriginal participation in West Coast energy development | 17.3 | 17.3 | |||||
| h. Increase in funding from the new Building Canada Fund to support investments through the First Nations Infrastructure Fund | 15.0 | 15.0 | |||||
| i. Increase in funding for the Consolidated Urban Aboriginal Strategy | 0.9 | 12.4 | 0.1 | 13.4 | |||
| j. Other various initiatives (net) * | (18.2) | (1.8) | 18.9 | 1.5 | 0.4 | ||
| k. Decrease in funding to meet the Government of Canada`s obligations under the Northwest Territories Land and Resources Devolution Agreement | (27.9) | (7.1) | (3.0) | (38.0) | |||
| l. Decrease in funding primarily reflecting the sunset of targeted funding for initiatives to improve First Nations Education | (133.4) | (133.4) | |||||
| m. Decrease in funding for the Indian Residential Schools Settlement Agreement including funding for awards to claimants resulting from the Independent Assessment Process and Alternative Dispute Resolution, funding for the administration and research required to support the federal government's obligations under the agreement as well as funding related to the Indian Residential Schools Truth and Reconciliation Commission | (180.6) | (4.3) | (184.9) | ||||
| 1st Qtr : Total increase / (decrease) to Departmental Authorities | 38.1 | 24.1 | 182.1 | (5.0) | (30.0) | - | 209.3 |
| n. Operating Budget Carry Forward | (8.0) | (8.0) | |||||
| o. Capital Operation Budget Carry Forward | (0.6) | (0.6) | |||||
| p. Canadian High Arctic Research Station - Deemed Appropriations ** | (6.3) | (1.7) | (8.0) | ||||
| q. Increase in funding for the Canadian High Arctic Research Station - Major Crown Project | 10.8 | 10.8 | |||||
| r. Funding for Déline First Nation Self-Government | 1.0 | 1.0 | |||||
| 2nd Qtr : Total increase / (decrease) to Departmental Authorities | 23.8 | 34.3 | 181.4 | (5.0) | (30.0) | - | 204.5 |
| * e.g. Other - year over year net increase in funding, as of June 30, 2015, for various initiatives include Self-Government agreements and Nutrition North Canada program; net decrease in funding for Federal Contaminated Sites, Métis Aboriginal rights and the management of Métis and non-status Indian litigation. | |||||||
| ** Canadian High Arctic Research Station (CHARS) - Deemed appropriation: Transfer from AANDC for the creation of Polar Knowledge Canada | |||||||
- As shown in the table above, the $204.5 million increase in total authorities is primarily attributed to the increase of $53.1 million in Operating authority (Vote 1 and 5) and an increase of $151.4 million in Grants and Contributions authority.
- The year over year net increase of $53.1 million in Operating authority (Operating and Vote 5) is due to an increase of funding for claims related activities and settlement of litigation ($253.0M) , Construction of the Canadian High Arctic Research Station Major Crown project ($10.6M in Vote 1 and $36.7M in Vote 5). This increase is offset by the decrease in funding for the Indian Residential Schools Settlement Agreement and related funding for the Indian Residential Schools Truth and Reconciliation Commission ($180.6M), Northwest Territories Land and Resources Devolution Agreement ($27.9M), the deemed appropriation to Polar Knowledge Canada for the Canadian High Arctic Research Station programming ($6.3M Vote 1), the Carry Forward ($8.0M in Vote 1 and $600K in Vote 5), miscellaneous reduction in Vote 1 Operating ($18.8M) and in Statutory Operating ($5.0M).
- The year over year net increase of $151.4 million in Grants and Contributions authority is primarily due to an increase in funding for ongoing Indian and Inuit programs providing access to basic services ($104.6M), the renovation and construction of schools on reserve across the country ($50M), Operation Return Home ($40.6M) and Emergency Management on reserve ($32.3M), claim activities ($18.8M) , West Coast energy development ($17.3M), Canadian High Arctic Research Station ($12.7M), First Nation infrastructure fund ($15.0M), Urban aboriginal Strategy ($12.4M) and other miscellaneous increase of $19.9M. This increase is offset by the decrease of funding related to Northwest Territories Devolution ($7.1M), Statutory Grants and Contributions authority due to the sunset of statutory funding for the Nisga'a Nation and the Labrador Inuit ($30.0M), reduction of Canadian High Arctic Research Station deemed appropriation ($1.7M) and reduction of targeted funding for initiatives to improve First Nation Education ($133.4M). Reduced funding within First Nation Education is being offset through the renewal of funding that has been accessed within the first quarter and through future Estimates process.
2.2 Statement of Departmental Budgetary Expenditures by Standard Object (Table 2)
Highlights of Fiscal Quarter ended September 30, 2015
The Department is estimating budgetary expenditures of $8.6 billion in 2015-2016. In the second quarter, departmental expenditures were $429 million higher than the same period in 2014-2015. 22% of total available budgetary authorities were expended compared to 17.9% in previous year second quarter. Year-to-date expenditures account for 44.1% of the total available authorities compared to 39.5% in the same period in 2014-15.
As indicated in table 2, the total increase in expenditure of $429.0 million can be attributed to an increase of $222.3 million in Grant and Contribution expenditures, $215.2 million in other subsidies and payments and $15.0 million for Acquisition of lands and offset by reduced spending of $7.3 million in Personnel (Standard Object 01), $1.1 million in Transportation and Communication (Standard Object 02), $1.5 million in Communication (Standard Object 03), $11.4 million in Professional and special services (Standard Object 04), $1.5 million in Rentals (Standard Object 05) and $0.7 million in various Other Operating expenditure (Standard Object 06, 07 and 09).
($ millions)
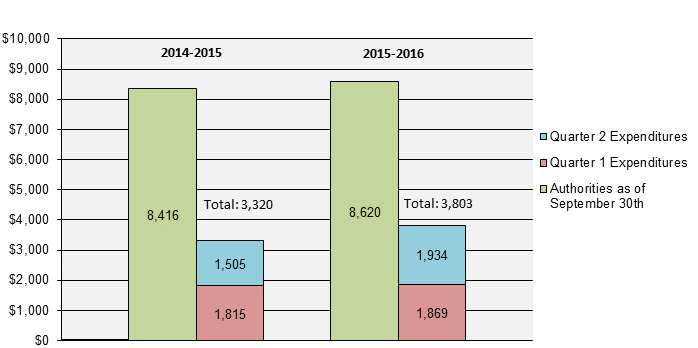
Text description of the above chart
This image is of a bar graph of the year-to-date comparison of budgetary authorities and expenditures as of the end of September 30th, 2015. The graph plots the authorities and expenditures by quarter arriving at a year to date total for the fiscal years 2014-2015 and 2015-2016.
The 2014-2015 data shows the Q2 authorities equaling the Main Estimates, the Supplementary Estimates A and Carry Forward authorities arriving at the total authority at the end of Q2 of $8,416M. The 2015-2016 data shows the Q2 authorities equaling the Main Estimates, the Supplementary Estimates A and Carry Forward authorities arriving at the total authority at the end of Q2 of $8,620M.
The net difference in comparing the authorities at the end of Q2 each fiscal year is an increase of $204.5M from 2014-2015 to 2015-2016.
The second column of each section of the graph pertains to expenditures. The 2014-2015 data shows the Q2 expenditures of $1,505M. The 2015-2016 data shows the Q2 expenditures of $1,934M. The net difference in comparing the expenditures at the end of Q2 each fiscal year is an increase of $429M from 2014-15 to 2015-2016.
3. Risks and Uncertainties
3.1 Risks and Uncertainties
Risk management and risk-based decision-making have become a critical component in the way the Department prioritizes and conducts its business. Resource allocation decisions are informed by risk and the Department's key corporate risks are discussed systematically by the senior management committee, which contributes to the better allocation of resources and ultimately better results.
In terms of financial risk, the Department is operating in an environment of fiscal restraint in which the ability to reallocate resources internally is reduced. The Department continues to monitor its risk exposure and take action as needed to mitigate the risk of not achieving anticipated outcomes or to deal with emerging pressures. Achievement of AANDC's strategic outcomes and delivery of programs is dependent on timely access to appropriate authorities and funding levels.
In terms of transfer payment program and transfer payment recipient risk, the Department transfers approximately $7 billion dollars to recipients each year, while balancing program and recipient risks to deliver on its mandate. The Department undertakes risk assessments on new, existing and reformed programs as well as an annual General Assessment of each recipient to identify certain areas at risk as history has substantiated a link between risk level and default prevention.
3.2 Risk Mitigating Strategies
Corporate and financial risk mitigation activities, reflected in the Department's Corporate Risk Profile, are monitored by senior management on a semi-annual basis and modified as required. A number of practices and internal controls help to manage risk departmentally, including senior management governance and oversight as established through committees, existing policies and procedures that ensure an appropriate level of monitoring, review and reporting.
The Department is addressing reduced flexibility to its budget as a result of expenditure restraint measures by aligning resources to needs and through rigorous monitoring against both financial and human resource targets. Management proactively and systematically manages and responds to risks to minimize adverse impacts and capitalize on opportunities. For example, cost containment measures and expenditure trends are monitored regularly, including a review and challenge function, through the Financial Status Report.
In order to ensure effective controls, transparency and accountability, a risk-based approach is used to confirm that recipients have met planned program outcomes and results; that they are in compliance with funding agreements; and, that the funds were used to the intended purposes. In addition, the ability to conduct audits of recipients, under the terms of their funding agreements; provide a further opportunity to ensure that First Nations have appropriate management, financial and administrative controls in place.
4. Significant changes in relation to Operations, Personnel and Programs
Significant changes in relation to Operations, Personnel and Programs during the first quarter of fiscal year 2015-16 include:
- Lynda Clairmont was appointed as Senior Assistant Deputy Minister, Regional Operations, effective September 8, 2015.
5. Approval by Senior Officials
Approved, as required by the Treasury Board Policy on Financial Resource Management, Information and Reporting:
Original signed by
_______________________
Colleen Sword
Deputy Minister
Date:November 25, 2015
City: Gatineau
Original signed by
_______________________
Paul J. Thoppil, CPA, CA
Chief Financial Officer
Date: November 24, 2015
City: Gatineau
| Fiscal year 2015-2016 | Fiscal year 2014-2015 | Variances | ||||||||
|---|---|---|---|---|---|---|---|---|---|---|
| Total available for use for the year ending March 31, 2016* | Used during the quarter ended September 30, 2015 | Year to date used at quarter-end | Total available for use for the year ending March 31, 2015* | Used during the quarter ended September 30, 2014 | Year to date used at quarter-end | Authority | Qtr | YTD | ||
| Operating expenditures | 1,375,857 | 489,444 | 738,441 | 1,352,049 | 290,489 | 477,408 | 23,808 | 198,955 | 261,033 | |
| Capital expenditures | 53,255 | 16,005 | 18,922 | 18,926 | 6,132 | 6,649 | 34,329 | 9,873 | 12,273 | |
| Grants and contributions | 7,044,897 | 1,384,684 | 2,973,135 | 6,863,465 | 1,167,925 | 2,741,962 | 181,432 | 216,759 | 231,173 | |
| Budgetary statutory authorities - Operating Expenditures: | ||||||||||
| Contributions to employee benefit plans | 58,826 | 14,678 | 29,356 | 63,838 | 15,324 | 30,649 | (5,012) | (646) | (1,293) | |
| Minister of Aboriginal Affairs and Northern Development – Salary and motor car allowance | 82 | 21 | 41 | 80 | 40 | 40 | 2 | (19) | 1 | |
| Payments to comprehensive claim beneficiaries in compensation for resource royalties | 2,638 | 0 | 0 | 2,622 | 2,768 | 3,486 | 16 | (2,768) | (3,486) | |
| Liabilities in respect of loan guarantees made to Indians for Housing and Economic Development | 2,000 | 2,156 | 2,156 | 2,000 | 10 | 10 | 0 | 2,146 | 2,146 | |
| Grassy Narrows and Islington Bands Mercury Disability Board | 15 | 0 | 0 | 15 | 0 | 0 | 0 | 0 | 0 | |
| Other | 0 | 771 | 2,148 | 0 | 1,994 | 4,832 | 0 | (1,223) | (2,684) | |
| Budgetary statutory authorities - Transfer Payments: | ||||||||||
| Grants to Aboriginal organizations designated to receive claim settlement payments pursuant to Comprehensive Land Claim Settlement Acts | 54,589 | 21,960 | 31,651 | 75,611 | 20,581 | 52,663 | (21,022) | 1,379 | (21,012) | |
| Grant to the Nunatsiavut Government for the implementation of the Labrador Inuit Land Claims Agreement pursuant to the Labrador Inuit Land Claims Agreement Act | 0 | 0 | 0 | 8,994 | 0 | 0 | (8,994) | 0 | 0 | |
| Indian Annuities Treaty payments | 1,400 | (434) | 2,038 | 1,400 | (110) | 2,364 | 0 | (324) | (326) | |
| Contributions in connection with First Nations infrastructure | 26,731 | 4,899 | 5,200 | 26,731 | 0 | 0 | 0 | 4,899 | 5,200 | |
| Total Budgetary Authorities | 8,620,290 | 1,934,184 | 3,803,090 | 8,415,731 | 1,505,153 | 3,320,063 | 204,559 | 429,031 | 483,027 | |
| Non-Budgetary Authorities: | ||||||||||
| Loans to native claimants | 39,903 | 4,116 | 7,485 | 39,903 | 3,596 | 6,399 | 0 | 520 | 1,086 | |
| Loans to First Nations in British Columbia | 30,400 | 6,489 | 6,489 | 30,400 | 6,411 | 8,105 | 0 | 78 | (1,616) | |
| Total Non-Budgetary Authorities | 70,303 | 10,605 | 13,974 | 70,303 | 10,007 | 14,504 | 0 | 598 | (530) | |
| Total Authorities | 8,690,593 | 1,944,788 | 3,817,064 | 8,486,034 | 1,515,160 | 3,334,567 | 204,559 | 429,628 | 482,497 | |
| * Including only Authorities available for use and granted by Parliament at quarter-end. | ||||||||||
| Fiscal year 2015-2016 | Fiscal year 2014-2015 | Variances | |||||||
|---|---|---|---|---|---|---|---|---|---|
| Expenditures | Planned expenditures for the year ending March 31, 2016 | Expended during the quarter ended September 30, 2015 | Year to date used at quarter-end | Planned expenditures for the year ending March 31, 2015* | Expended during the quarter ended September 30, 2014 | Year to date used at quarter-end | Planned | Qtr | YTD |
| 1 Personnel | 413,317 | 104,868 | 211,704 | 447,772 | 112,178 | 220,206 | (34,455) | (7,310) | (8,502) |
| 2 Transportation and communications | 29,527 | 5,868 | 9,908 | 41,981 | 6,942 | 8,465 | (12,454) | (1,074) | 1,443 |
| 3 Information | 14,598 | 1,359 | 2,483 | 20,193 | 2,847 | 3,227 | (5,595) | (1,488) | (744) |
| 4 Professional and special services | 323,982 | 38,600 | 55,970 | 343,623 | 50,017 | 60,341 | (19,641) | (11,417) | (4,371) |
| 5 Rentals | 14,659 | 1,764 | 2,609 | 19,109 | 3,224 | 3,279 | (4,450) | (1,460) | (670) |
| 6 Purchased repair and maintenance | 2,759 | 192 | 329 | 3,606 | 444 | 456 | (847) | (252) | (127) |
| 7 Utilities, materials and supplies | 5,907 | 678 | 1,047 | 8,738 | 929 | 977 | (2,831) | (251) | 70 |
| 8 Acquisition of land, buildings and works | 47,648 | 15,004 | 17,632 | 14,303 | 53 | 53 | 33,345 | 14,951 | 17,579 |
| 9 Acquisition of machinery and equipment | 399 | 272 | 424 | 2,992 | 431 | 461 | (2,593) | (159) | (37) |
| 10 Transfer payments | 7,127,617 | 1,411,109 | 3,012,025 | 6,976,200 | 1,188,854 | 2,797,448 | 151,417 | 222,255 | 214,577 |
| 11 Public debt charges | 0 | 0 | 0 | 0 | 0 | 0 | 0 | 0 | 0 |
| 12 Other subsidies and payments | 640,586 | 354,471 | 488,960 | 537,924 | 139,234 | 225,150 | 102,662 | 215,237 | 263,810 |
| Total gross budgetary expenditures | 8,620,999 | 1,934,184 | 3,803,090 | 8,416,441 | 1,505,153 | 3,320,063 | 204,559 | 429,031 | 483,027 |
| Less: Revenues netted against expenditures | |||||||||
| Internal Services | (710) | 0 | 0 | (710) | 0 | 0 | 0 | 0 | 0 |
| Total Revenues netted against expenditures | (710) | 0 | 0 | (710) | 0 | 0 | 0 | 0 | 0 |
| Total net budgetary expenditures | 8,620,290 | 1,934,184 | 3,803,090 | 8,415,731 | 1,505,153 | 3,320,063 | 204,559 | 429,031 | 483,027 |