Archived - Aboriginal Affairs and Northern Development Canada - Quarterly Financial Report - For the Quarter Ended June 30, 2014
Archived information
This Web page has been archived on the Web. Archived information is provided for reference, research or record keeping purposes. It is not subject to the Government of Canada Web Standards and has not been altered or updated since it was archived. Please contact us to request a format other than those available.
1. Introduction
This quarterly financial report has been prepared by management as required by section 65.1 of the Financial Administration Act and in the form and manner prescribed by the Treasury Board. It should be read in conjunction with the Main Estimates and Supplementary Estimates (A) for fiscal year 2014-2015 as well as Canada's Economic Action Plan 2014 (Budget 2014). For purposes of both the Main and Supplementary Estimates, the Department is referred to as Indian Affairs and Northern Development.
The quarterly financial report has not been subject to an external audit or review.
1.1 Authority, Mandate and Program Activities
Aboriginal Affairs and Northern Development Canada (AANDC) supports Aboriginal people (First Nations, Inuit and Métis) and Northerners in their efforts to:
- Improve social well-being and economic prosperity;
- Develop healthier, more sustainable communities; and
- Participate more fully in Canada's political, social and economic development – to the benefit of all Canadians.
Further details on AANDC's authority, mandate and program activities can be found in Part II of the Main Estimates and the Report on Plans and Priorities.
1.2 Basis of Presentation
This quarterly report has been prepared by management using an expenditure basis of accounting and a special purpose financial reporting framework designed to meet financial information needs with respect to the use of spending authorities. The accompanying Statement of Authorities includes AANDC's spending authorities granted by Parliament and those used by the Department consistent with the Main Estimates and Supplementary Estimates (A) for the 2014-2015 fiscal year.
The authority of Parliament is required before monies can be spent by the Government. Approvals are given in the form of annually approved limits through appropriation acts or through legislation in the form of statutory spending authority for specific purposes.
The Department uses the full accrual method of accounting to prepare and present its annual departmental financial statements that are part of the departmental performance reporting process. However, the spending authorities voted by Parliament remain on an expenditure basis.
1.3 AANDC's Financial Structure
The parliamentary vote structure of AANDC is made up of $8.4 billion in budgetary authorities of which $8.2 billion requires approval by Parliament; referred to as voted amounts. The remaining $181.3 million represents statutory authorities that do not require additional approval and are provided for information purposes.
Voted amounts totalling $8.2 billion are split between Operating Expenditures, Capital Expenditures and Grants and Contributions as follows:
- Operating Expenditures represents approximately $1.3 billion (16 percent) - this includes
$519.4 million (6.3 percent) for the Settlement Allotment (Independent Assessment Process and Alternative Dispute Resolution) and $124.8 million (1.5 percent) for the assessment, management and remediation of federal contaminated sites. - Capital represents approximately $16.3 million (0.2 percent)
- Grants and Contributions represent approximately $6.9 billion (83.8 percent)
More detailed information about AANDC's financial structure, including information about the fiscal cycle, cost drivers, expenditure trends, etc. can be found in the 2014-15 Financial Overview.
2. Highlights of fiscal quarter and fiscal year to date (YTD) results
This section highlights the significant items that contributed to the net increase or decrease in resources available for the year and actual expenditures for the quarter ended June 30, 2014. The explanation of variances considers that changes under five percent would have minimal impact on interpretation of results.
2.1 Statement of Authorities (Table 1)
The Quarterly Financial Report reflects the year over year change in authorities for the period April 1 to June 30, 2014. Total year-to-date authorities available for use in the first quarter of 2014-2015 were $8,440.6 million compared to $8,141.1 million for the same quarter of the prior year, representing an increase in Departmental Authorities of $299.5 million. The total 2014-2015 year-to-date authority increase of $299.5 million over 2013-2014 can be explained as follows:
| Program | Increase/(Decrease) in Authorities Available for Use (values in millions of dollars) | ||||||
|---|---|---|---|---|---|---|---|
| Budgetary | Non-Budgetary | Total | |||||
| Vote 1 - Operating | Vote 5 - Capital | Vote 10 - Grants and Contributions | Statutory - Operating | Statutory – Grants and Contributions | |||
| a. Net increase in the cash flow for the negotiation, settlement and implementation of specific and comprehensive claims (primarily for the continued implementation of Justice at Last: Specific Claims Action Plan) | 26.2 | (6.0) | 285.5 | 0.5 | 1.8 | ||
| b. Increase in funding to meet increased demand for ongoing Indian and Inuit programs which reflects a 2% allowance for inflation and population growth and provides access to basic services such as education, housing, community infrastructure (water and sewage systems), and social support services | 0.3 | 102.6 | 102.9 | ||||
| c. Increase in funding pursuant to funding approved in Economic Action Plan 2012 to support the construction and/or renovation of schools on reserves | 33.0 | 33.0 | |||||
| d. Increase in funding for the renewal of Gas Tax Funding | 26.7 | 26.7 | |||||
| e. Other various initiatives (net)* | (14.2) | 8.6 | 14.2 | (1.9) | 6.7 | ||
| f. Decrease in funding for the assessment, management and remediation of federal contaminated sites | (34.5) decrease | 14.3 | (20.2) | ||||
| g. Decrease in funding for the Indian Residential Schools Settlement Agreement including funding for awards to claimants resulting from the Independent Assessment Process and Alternative Dispute Resolution as well as funding for the administration and research required to support the federal government's obligations under the agreement | (52.1) | (0.1) | (52.2) | ||||
| h. Decrease in funding reflecting the savings identified as part of the Economic Action Plan 2012 Spending Review | (30.8) | (69.7) | (4.9) | (105.4) | |||
| First Quarter - Total increase/(decrease) to Departmental Authorities | (105.1) | 2.6 | 379.9 | (6.4) | 28.5 | 0.0 | 299.5 |
| *e.g. Increase in funding for the Family Violence Prevention Program, First Nations Land and Management Regime and post-secondary education for First Nations and Inuit students & business studies by Aboriginal students; and decrease in funding for Maa-nulth First Nation and Canadian High Arctic Research Station. | |||||||
- As shown in the table above, the $299.5 million increase in total authorities is primarily attributed to the decrease of $105.1 million in Operating expenditures authority and the increase of $379.9 million in Grants and Contributions authority.
- The decrease of $105.1 million in Operating expenditures authority is primarily due to a decrease of funding for the Indian Residential Schools Settlement Agreement ($52.1 million), the assessment, management and remediation of federal contaminated sites ($34.5 million) and the savings identified as part of the Budget 2012 Spending Review ($30.8 million). This decrease is partially offset by the increase in funding for claims activities ($26.2 million).
- The increase of $379.9 million in Grants and Contributions authority is primarily due to an increase in funding for claims activities ($285.5 million), ongoing Indian and Inuit programs providing access to basic services ($102.6 million) and initiatives to support the construction and/or renovation of schools on reserves ($33 million). This increase is partially offset by the savings identified as part of the Budget 2012 Spending Review ($69.7 million).
2.2 Statement of Departmental Budgetary Expenditures by Standard Object (Table 2)
Highlights of Fiscal Quarter ended June 30, 2014
The Department is estimating budgetary expenditures of $8.4 billion in 2014-2015. In the first quarter, 21.7% of total available authorities were expended for which departmental expenditures were $16.6 million lower than the same period in 2013-2014. This net decrease of 1.0% can be attributed mainly to a decrease of $22.5 million in operating expenditures offset by an increase of $5.9 million in transfer payments.
Reduced spending in 2014-2015 is largely attributed to Personnel (standard object 1) by $14.4 million which were related to the savings through the Budget 2012 Spending Review, funds transferred to the Northwest Territories as part of Northwest Territories Devolution on April 1, 2014, and decreases related to collective bargaining, such as severance pay.
Professional and special services (standard object 4) saw a reduction by $5.9 million in 2014-2015 primarily due to contractual obligations transferred to the Northwest Territories as part of Northwest Territories Devolution on April 1, 2014 as well as administrative requirements related to the issuance of contracts with the transition to a new financial management system.
The reduction to Transportation and Communications (standard object 2) by $2.1 million in 2014-2015 is primarily related to additional efficiencies and increased use of technology.
The increase of $5.9 million in Transfer Payments (standard object 10) is mainly related to the advancement of the funding cycle, with 2014-2015 agreements concluded before April 1, 2014, resulting in AANDC's ability to issue funds earlier.
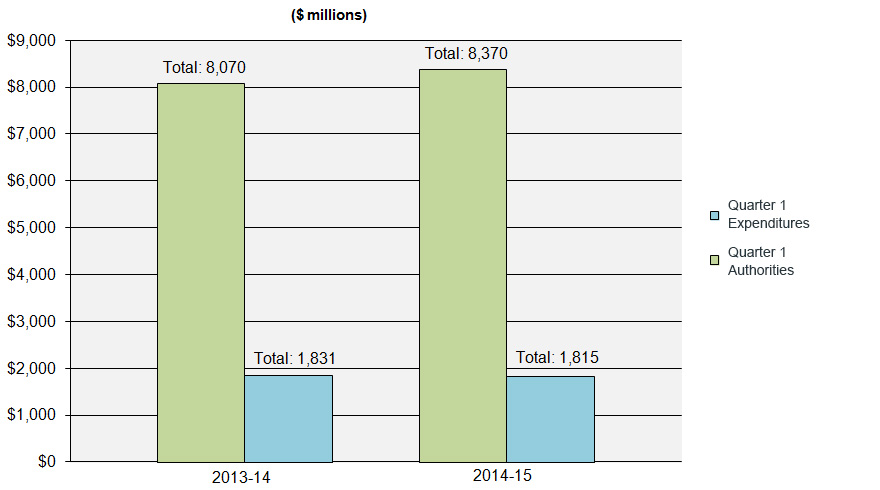
Text description of Year-to-Date Comparison of Budgetary Authorities and Expenditures as of June 30, 2014
This image is of a bar graph of the year-to-date comparison of budgetary authorities and expenditures as of the end of June 30th, 2014. The graph plots the authorities and expenditures by quarter arriving at a year to date total for the fiscal years 2013-14 and 2014-15.
The 2013-14 data shows the Q1 authorities equaling the Main Estimates and the Supplementary Estimates A authorities arriving at the total authority at the end of Q1 of $8,070M. The 2014-2015 data shows the Q1 authorities equaling the Main Estimates and the Supplementary Estimates A authorities arriving at the total authority at the end of Q1 of $8,370M.
The net difference in comparing the authorities at the end of Q1 each fiscal year is an increase of $300M from 2013-14 to 2014-15.
The second column of each section of the graph pertains to expenditures. The 2013-14 data shows the Q1 expenditures of $1,831M. The 2014-15 data shows the Q1 expenditures of $1,815M. The net difference in comparing the expenditures at the end of Q1 each fiscal year is a decrease of $16M from 2013-14 to 2014-15.
3. Risks and Uncertainties
3.1 Risks and Uncertainties
Risk management and risk-based decision-making have become a critical component in the way the Department prioritizes and conducts its business. Resource allocation decisions are informed by risk and the Department's key corporate risks are discussed systematically by the senior management committee, which contributes to the better allocation of resources and ultimately better results.
In terms of financial risk, the Department is operating in an environment of diminished operating resources in which the ability to reallocate resources internally is reduced. The Department continues to monitor its risk exposure and take action as needed to mitigate the risk of not achieving anticipated outcomes or to deal with emerging pressures. Achievement of AANDC's strategic outcomes and delivery of programs is dependent on timely access to appropriate authorities and funding levels.
In terms of transfer payment program and transfer payment recipient risk, the Department transfers over $6 billion dollars to recipients each year, while balancing program and recipient risks to deliver on its mandate. The Department undertakes risk assessments on new, existing and reformed programs as well as an annual General Assessment of each recipient to identify certain areas at risks as history has substantiated a link between risk level and default prevention.
3.2 Risk Mitigating Strategies
Corporate and financial risk mitigation activities are reflected in the Corporate Business Plan and are monitored by senior management on a quarterly basis and modified as required. A number of practices and internal controls help to manage risk departmentally, including senior management governance and oversight as established through committees, existing policies and procedures that ensure an appropriate level of monitoring, review and reporting.
The Department is addressing reduced flexibility to its budget as a result of expenditure restraint measures by aligning resources to needs and is complimented by rigorous monitoring against both financial and human resource targets. Management proactively, systematically and continuously manages and responds to risks to minimize adverse impacts and capitalize on opportunities. For example, cost containment measures and trend monitoring are monitored monthly, including a review and challenge function, through the Financial Status Report.
Established management control frameworks, governance structures and a policy framework mitigate risks throughout the program life-cycle. For example, the Management Control Framework for grants and contributions requires that an audit be performed annually, where results incent the Department through the management action plan. Recipient risks are reviewed and updated annually through General Assessments and addressed through case management approaches and recipient audits which assist AANDC to focus on areas requiring attention.
4. Significant changes in relation to Operations, Personnel and Programs
Significant changes in relation to Operations, Personnel and Programs during the first quarter of fiscal year 2014-2015 include:
- Joe Wild was appointed as Senior Assistant Deputy Minister, Treaties and Aboriginal Government, effective May 20, 2014.
- Sheilagh Murphy was appointed the Assistant Deputy Minister, Lands and Economic Development, effective June 23, 2014.
5. Budget 2012 Implementation
This section provides an update of the savings measures announced in Budget 2012 that are being implemented in order to refocus government and programs; make it easier for Canadians and business to deal with their government; and modernize and reduce the back office.
Aboriginal Affairs and Northern Development Canada achieved savings of $24.4 million in the first year (2012-2013). Savings increased to $55.1 million in 2013-2014 and resulted in ongoing savings of $160.6 million commencing in 2014-2015.
There are no significant financial risks related to Budget 2012 savings for this quarterly financial report. AANDC continues to manage the implementation of Budget 2012 savings through its financial management and monitoring processes.
In the first quarter, the Department focussed on achieving outstanding milestones of savings measures to ensure internal operational changes are implemented to deliver efficient, effective and accountable programs for Aboriginal people and Northerners. To date, there are still five savings measures with minor outstanding milestones.
AANDC's Implementation Committee, chaired by the Associate Deputy Minister and composed of the Assistant Deputy Ministers and direct reports to the Deputy Minister, did not meet during the first quarter to provide direction, coordination and oversight on outstanding departmental deficit reduction savings implementation activities but will do so in the second quarter. Instead, the Implementation Committee met and undertook a collective exercise to chart Department-wide implementation activities to identify other means and mechanisms where effectiveness and efficiencies could be derived. The Workforce Management Board also continued to provide oversight on workforce management mechanisms and to ensure consistency and fairness in human resource decisions across the Department.
6. Approval by Senior Officials
Approved, as required by the Treasury Board Policy on Financial Resource Management, Information and Reporting:
Original signed by
Hélène Laurendeau for
__________________________
Colleen Swords
Deputy Minister
Date: August 20, 2014
City: Gatineau
Original signed by
Catherine Blanchard for
_________________________
Pamela D'Eon
A/Chief Financial Officer
Date: August 18, 2014
City: Ottawa
Statement of Authorities (unaudited) - Table 1
| Fiscal year 2014-2015 | Fiscal year 2013-2014 | Variances | |||||||
|---|---|---|---|---|---|---|---|---|---|
| Vote | Total available for use for the year ending March 31, 2015* | Used during the quarter ended June 30, 2014 | Year to date used at quarter-end | Total available for use for the year ending March 31, 2014* | Used during the quarter ended June 30, 2013 | Year to date used at quarter-end | Authority | Qtr | YTD |
| 1 Operating expenditures | 1,309,225 | 186,918 | 186,918 | 1,414,329 | 209,814 | 209,814 | (105,104) | (22,896) | (22,896) |
| 5 Capital expenditures | 16,296 | 517 | 517 | 13,683 | 417 | 417 | 2,613 | 100 | 100 |
| 10 Grants and contributions | 6,863,465 | 1,574,038 | 1,574,038 | 6,483,588 | 1,568,474 | 1,568,474 | 379,877 | 5,564 | 5,564 |
| (S) Budgetary statutory authorities - Operating Expenditures | |||||||||
| Contributions to employee benefit plans | 63,838 | 15,324 | 15,324 | 70,304 | 17,576 | 17,576 | (6,466) | (2,252) | (2,252) |
| Minister of Aboriginal Affairs and Northern Development – Salary and motor car allowance | 80 | - | - | 79 | 17 | 17 | 1 | (17) | (17) |
| Payments to comprehensive claim beneficiaries in compensation for resource royalties | 2,622 | 718 | 718 | 2,606 | 674 | 674 | 16 | 45 | 45 |
| Liabilities in respect of loan guarantees made to Indians for Housing and Economic Development | 2,000 | - | - | 2,000 | - | - | 0 | 0 | 0 |
| Grassy Narrows and Islington Bands Mercury Disability Board | 15 | - | - | 15 | - | - | 0 | 0 | 0 |
| Other | 2,838 | 2,838 | 300 | 300 | 0 | 2,538 | 2,538 | ||
| (S) Budgetary statutory authorities - Transfer Payments | |||||||||
| Grants to Aboriginal organizations designated to receive claim settlement payments pursuant to Comprehensive Land Claim Settlement Acts | 75,611 | 32,082 | 32,082 | 73,762 | 32,074 | 32,074 | 1,849 | 8 | 8 |
| Grant to the Nunatsiavut Government for the implementation of the Labrador Inuit Land Claims Agreement pursuant to theLabrador Inuit Land Claims Agreement Act | 8,994 | - | - | 8,994 | - | - | 0 | 0 | 0 |
| Indian Annuities Treaty payments | 1,400 | 2,474 | 2,474 | 1,400 | 2,122 | 2,122 | 0 | 353 | 352 |
| Contributions in connection with First Nations infrastructure | 26,731 | - | - | - | - | - | 26,731 | 0 | 0 |
| Total Budgetary Authorities | 8,370,277 | 1,814,910 | 1,814,910 | 8,070,760 | 1,831,468 | 1,831,468 | 299,517 | (16,558) | (16,558) |
| Non-Budgetary Authorities | |||||||||
| Loans to native claimants | 39,903 | 2,803 | 2,803 | 39,903 | 680 | 680 | 0 | 2,123 | 2,123 |
| Loans to First Nations in British Columbia for the purpose of supporting their participation in the British Columbia Treaty Commission Process | 30,400 | 1,694 | 1,694 | 30,400 | 825 | 825 | 0 | 869 | 869 |
| Total Non-Budgetary Authorities | 70,303 | 4,497 | 4,497 | 70,303 | 1,505 | 1,505 | 0 | 2,992 | 2,992 |
| Total Authorities | 8,440,580 | 1,819,407 | 1,819,406 | 8,141,063 | 1,832,973 | 1,832,973 | 299,517 | (13,567) | (13,566) |
| *Including only Authorities available for use and granted by Parliament at quarter-end. | |||||||||
Departmental Budgetary Expenditures by Standard Object (unaudited) - Table 2
| Fiscal year 2014-2015 | Fiscal year 2013-2014 | Variances | |||||||
|---|---|---|---|---|---|---|---|---|---|
| Planned expenditures for the year ending March 31, 2015 | Expended during the quarter ended June 30, 2014 | Year to date used at quarter-end | Planned expenditures for the year ending March 31, 2014 | Expended during the quarter ended June 30, 2013 | Year to date used at quarter-end | Planned | Qtr | YTD | |
| Expenditures | |||||||||
| 1 Personnel | 447,772 | 108,027 | 108,027 | 474,431 | 122,399 | 122,399 | (26,659) | (14,372) | (14,372) |
| 2 Transportation and communications | 37,869 | 1,523 | 1,523 | 40,699 | 3,590 | 3,590 | (2,830) | (2,067) | (2,067) |
| 3 Information | 18,215 | 380 | 380 | 17,728 | 825 | 825 | 487 | (445) | (445) |
| 4 Professional and special services | 309,969 | 10,324 | 10,324 | 344,668 | 16,180 | 16,180 | (34,699) | (5,856) | (5,856) |
| 5 Rentals | 17,237 | 55 | 55 | 10,460 | 1,149 | 1,149 | 6,777 | (1,094) | (1,094) |
| 6 Purchased repair and maintenance | 3,253 | 13 | 13 | 3,521 | 57 | 57 | (268) | (44) | (44) |
| 7 Utilities, materials and supplies | 7,883 | 48 | 48 | 7,309 | 391 | 391 | 574 | (343) | (343) |
| 8 Acquisition of land, buidlings and works | 11,673 | - | - | 6,639 | - | - | 5,034 | 0 | 0 |
| 9 Acquisition of machinery and equipment | 2,992 | 30 | 30 | 20,000 | 179 | 179 | (17,008) | (149) | (149) |
| 10 Transfer payments | 6,976,200 | 1,608,594 | 1,608,594 | 6,567,744 | 1,602,670 | 1,602,670 | 408,456 | 5,924 | 5,924 |
| 11 Public debt charges | - | - | 0 | 0 | 0 | ||||
| 12 Other subsidies and payments | 537,924 | 85,916 | 85,916 | 578,311 | 84,028 | 84,028 | (40,387) | 1,888 | 1,888 |
| Total gross budgetary expenditures | 8,370,987 | 1,814,910 | 1,814,910 | 8,071,510 | 1,831,468 | 1,831,468 | 299,477 | (16,558) | (16,558) |
| Less: Revenues netted against expenditures | |||||||||
| Internal Services | (710) | - | - | (750) | - | - | 40 | 0 | 0 |
| Total Revenues netted against expenditures | (710) | - | - | (750) | - | - | 40 | 0 | 0 |
| Total net budgetary expenditures | 8,370,277 | 1,814,910 | 1,814,910 | 8,070,760 | 1,831,468 | 1,831,468 | 299,437 | (16,558) | (16,558) |