Archived - 2014-15 Financial Overview - July 2014
Archived information
This Web page has been archived on the Web. Archived information is provided for reference, research or record keeping purposes. It is not subject to the Government of Canada Web Standards and has not been altered or updated since it was archived. Please contact us to request a format other than those available.
PowerPoint Version (1.25 Mb, 15 Pages)
PDF Version (705 Kb, 15 Pages)
Table of contents
- Fiscal Cycle – Budgetary Expenditures
- Minister's Portfolio ($8.1 billion** in the 2014-15 Main Estimates)
- Expenditures by Category
- Expenditures by Program Alignment Architecture
- Expenditure Trend – Education
- Expenditure Trend – Social Development
- Expenditure Trend – Infrastructure and Capacity
- Expenditure Trend – Specific and Special Claims
- Program Delivery at AANDC
- Program Delivery – Demographic Realities
- Program Delivery – Geographic Realities (Small Communities)
- Program Delivery – Geographic Realities (Dispersed Communities)
- Program Delivery – Socio-Economic Realities
- Operating Environment – Economic Action Plan 2014
Fiscal Cycle – Budgetary Expenditures
Text description of Fiscal Cycle – Budgetary Expenditures
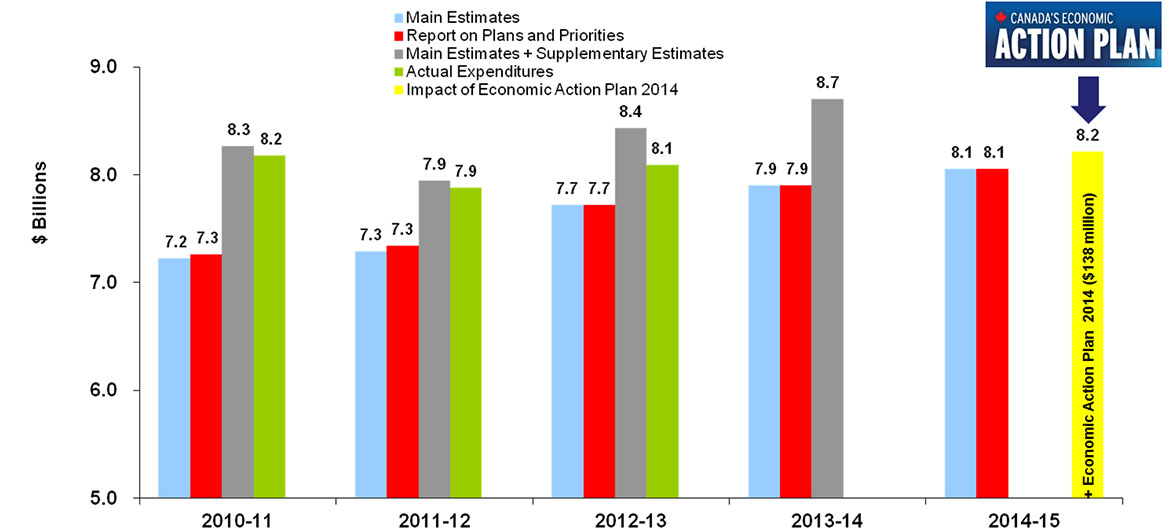
This is an image of a bar graph showing the budgetary dollar amounts in the annual estimates cycle for the department including the budgetary dollar amounts for the Main Estimates, Report on Plans and Priorities, Main and Supplementary Estimates and the actual expenditures for the fiscal years of 2010–11, 2011–12, 2012–13, 2013-14, and 2014–15. The dollar amounts for the actual expenses for fiscal years 2013–14 and 2014–15 are not included. The dollar amounts for the Main and Supplementary Estimates are not included for 2014–15. In addition, there is also a bar graph showing the impact of Economic Action Plan 2014.
For 2010–2011 the figures are: $7.2 billion, Main Estimates; $7.3 billion, Report on Plans and Priorities; $8.3 billion, Main and Supplementary Estimates; $8.2 billion, Actual Expenses.
For 2011–2012 the figures are: $7.3 billion, Main Estimates; $7.3 billion, Report on Plans and Priorities; $7.9 billion, Main and Supplementary Estimates; $7.9 billion, Actual Expenses.
For 2012–2013 the figures are: $7.7 billion, Main Estimates; $7.7 billion, Report on Plans and Priorities; $8.4 billion, Main and Supplementary Estimates; $8.1 billion, Actual Expenses.
For 2013–2014 the figures are: $7.9 billion, Main Estimates; $7.9 billion, Report on Plans and Priorities; $8.7 billion, Main and Supplementary Estimates.
For 2014–2015 the figures are: $8.1 billion, Main Estimates; $8.1 billion, Report on Plans and Priorities; $8.2 billion which reflects impact of Economic Action Plan 2014 ($138 million for AANDC).
Variances between Main Estimates, Planned Spending (as per the Report on Plans and Priorities) and Actual Expenditures are largely attributable to the timing of key elements in the fiscal cycle. The Main Estimates is the first step in the fiscal cycle. Additional funding for initiatives that were not ready in time to be included in the Main Estimates (i.e. Economic Action Plan 2014) is provided through Supplementary Estimates.
Further information on the Economic Action Plan 2014 is available online.
Minister's Portfolio ($8.1 billion** in the 2014-15 Main Estimates)
Aboriginal Affairs and Northern Development Canada ($8,079.9M):
Supports Aboriginal people (First Nations, Inuit and Métis) and Northerners in their efforts to improve social well-being and economic prosperity; develop healthier, more sustainable communities; and participate more fully in Canada's political, social and economic development to the benefit of all Canadians.
Canadian Polar Commission ($2.6M):
Monitors polar knowledge in Canada and around the world; works with Canadian and international institutions to determine scientific and other priorities; encourages support for Canadian polar research information to Canadians and fosters international co-operation in the advancement of polar knowledge.
Registry of the Specific Claims Tribunal ($2.9M):
Manages the administrative affairs of the Specific Claims Tribunal. The Tribunal is an adjudicative body with the express mandate of deciding First Nations' specific claims including claims related to non-fulfillment of treaties, fraud, illegal leases and dispositions or inadequate compensation for reserve lands or other assets.
Indian Residential Schools Truth and Reconciliation Commission ($2.1M):
The Commission has a mandate until June 30, 2015, to learn the truth about what happened in the residential schools, to inform all Canadians and to promote reconciliation.
** Figures reflect Budgetary and Non-budgetary amounts.
Expenditures by Category
Text description of Expenditures by Category
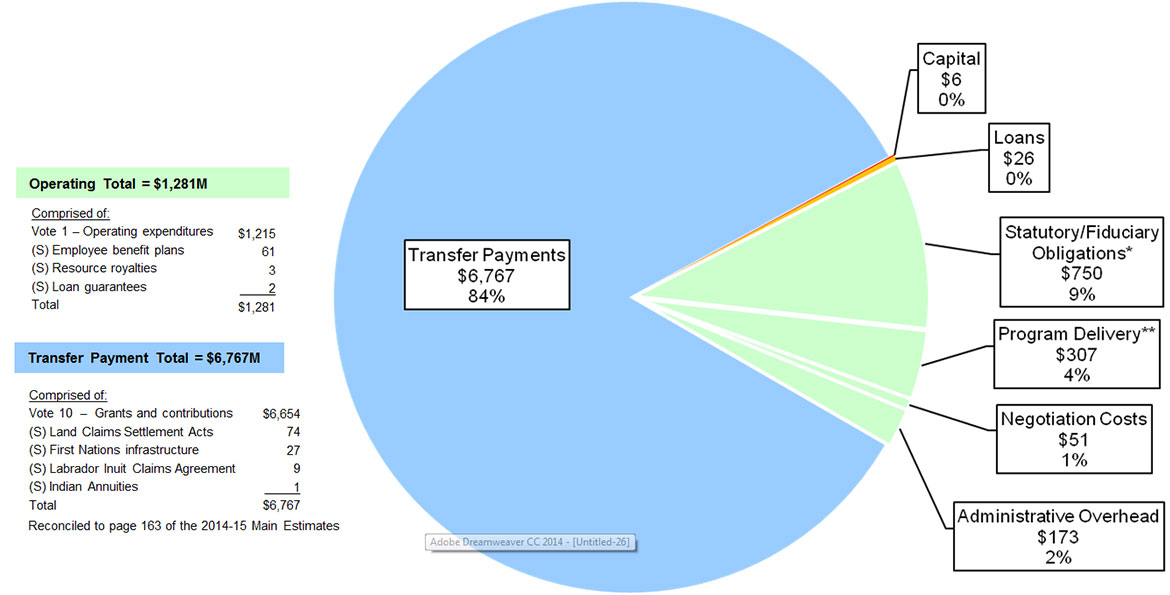
This image is of a pie chart showing the breakdown of departmental expenditures for 2014-15. The breakdown is shown as follows: $6,767 million (84%) transfer payments; $26 million (0%) loans; $6 million (0%) capital; $750 million (9%) statutory/fiduciary obligations; $307 million (4%) program delivery; $51 million (1%) negotiation costs; $173 million (2%) administrative overhead.
This image also contains two tables; the first demonstrates the breakdown of forecasted operating expenses – which total $1,281 million – as follows: $1,215 million for operating expenditures (Vote 1); and the following statutory expenses: $61 million for employee benefit plans; $3 million for resource royalties and $2 million for loan guarantees. The second table demonstrates the breakdown of transfer payments – which total $6,767 million – as follows: $6,654 million for grants and contributions (Vote 10); and the following statutory expenses: $74 million for land claims settlement acts, $27 million for First Nations infrastructure, $9 million for the Labrador Inuit Claims Agreement and $1 million for Indian annuities.
The source for the information for the chart is page 163 of the 2014-15 Main Estimates. Figures may not add due to rounding.
* The major item in the $750M is $646M for obligations stemming from the Indian Residential Schools Settlement Agreement. Furthermore, of the $750M, about $563M is for direct payments to recipients including obligations pursuant to the Indian Residential Schools Settlement Agreement, claims related obligations, Department of Justice costs, out-of-court settlements, etc.
** Program delivery costs directly benefit First Nation and northern communities and include costs associated with education, social development, capital/ infrastructure, economic development, Indian government support, environmental initiatives and northern programming. Of the $307M, about $75M is for direct payments to recipients, primarily related to the assessment, management and remediation of federal contaminated sites.
Expenditures by Program Alignment Architecture
Text description of Expenditures by Program Alignment Architecture
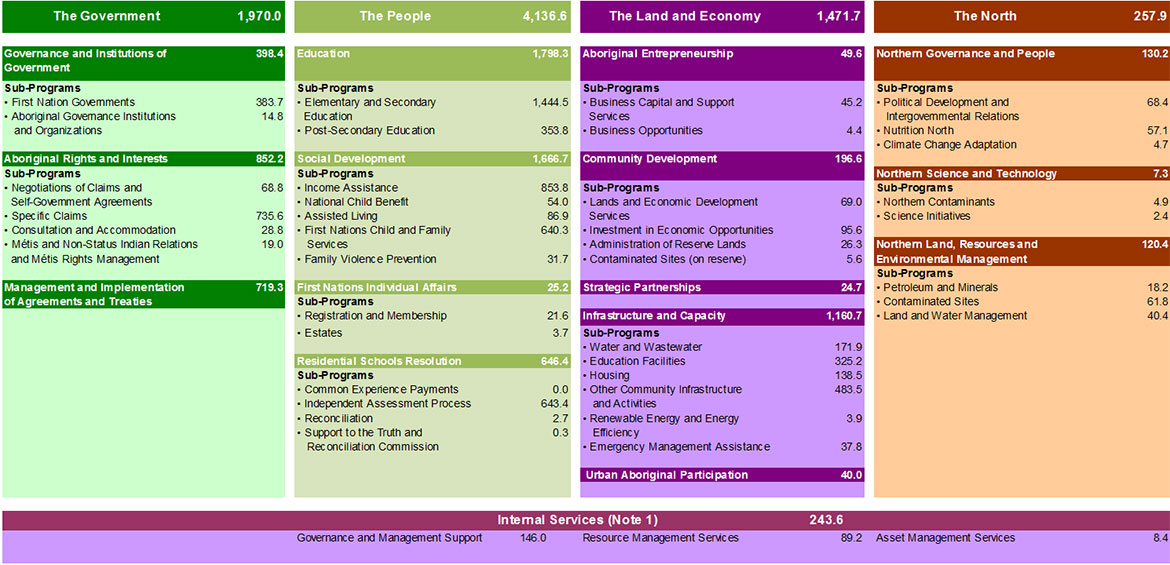
This image of the 2014-2015 Program Alignment Architecture breaks down the departmental 2014-2015 Main Estimates of $8,080 million (includes $26 million in non-budgetary expenditures or loans) by strategic outcome, program and sub-program as follows:
- The Government strategic outcome: $1,970.0 million
- The program Governance and Institutions of Government: $398.4 million
- The sub-program First Nation Governments: $383.7 million
- The sub-program Aboriginal Governance Institutions and Organizations: $14.8 million
- The program Aboriginal Rights and Interests: $852.2 million
- The sub-program Negotiations of Claims and Self-Government: $68.8 million
- The sub-program Specific Claims: $735.6 million
- The sub-program Consultation and Accommodation: $28.8 million
- The sub-program Métis and Non-Status Indian Relations and Métis Rights Management: $19.0 million
- The program Management and Implementation of Agreements and Treaties: $719.3 million
- The program Governance and Institutions of Government: $398.4 million
- The People strategic outcome: $4,136.6 million
- The program Education: $1,798.3 million
- The sub-program Elementary and Secondary Education: $1,444.5 million
- The sub-program Post-Secondary Education: $353.8 million
- The program Social Development: $1,666.7 million
- The sub-program Income Assistance: $853.8 million
- The sub-program National Child Benefit: $54.0 million
- The sub-program Assisted Living: $86.9 million
- The sub-program First Nations Child and Family Services: $640.3 million
- The sub-program Family Violence Prevention: $31.7 million
- The program First Nations Individual Affairs: $25.2 million
- The sub-program Registration and Membership: $21.6 million
- The sub-program Estates: $3.7 million
- The program Residential Schools Resolution: $646.4 million
- The sub-program Common Experience Payments: $0.0 million
- The sub-program Independent Assessment Process: $643.4 million
- The sub-program Reconciliation: $2.7 million
- The sub-program Support to the Truth and Reconciliation Commission:$0.3 million
- The program Education: $1,798.3 million
- The Land and Economy strategic outcome: $1,471.7 million
- The program Aboriginal Entrepreneurship: $49.6 million
- The sub-program Business Capital and Support Services: $45.2 million
- The sub-program Business Opportunities: $4.4 million
- The program Community Development: $196.6 million
- The sub-program Lands and Economic Development Services: $69.0 million
- The sub-program Investment in Economic Opportunities: $95.6 million
- The sub-program Administration of Reserve Lands: $26.3 million
- The sub-program Contaminated Sites (on-reserve): $5.6 million
- The program Strategic Partnerships: $24.7 million
- The program Infrastructure and Capacity: $1,160.7 million
- The sub-program Water and Wastewater Infrastructure: $171.9 million
- The sub-program Education Facilities: $325.2 million
- The sub-program Housing: $138.5 million
- The sub-program Other Community Infrastructure and Activities: $483.5 million
- The sub-program Renewable Energy and Energy Efficiency: $3.9 million
- The sub-program Emergency Management Assistance: $37.8 million
- The program Urban Aboriginal Participation: $40.0 million
- The program Aboriginal Entrepreneurship: $49.6 million
- The North strategic outcome: $257.9 million
- The program Northern Governance and People: $130.2 million
- The sub-program Political Development and Intergovernmental Relations: $68.4 million
- The sub-program Nutrition North: $57.1 million
- The sub-program Climate Change Adaptation: $4.7 million
- The program Northern Science and Technology: $7.3 million
- The sub-program Northern Contaminants Program: $4.9 million
- The sub-program Science Initiatives: $2.4 million
- The program Northern Land, Resources and Environmental Management: $120.4 million
- The sub-program Petroleum and Minerals: $18.2 million
- The sub-program Contaminated Sites: $61.8 million
- The sub-program Land and Water Management: $40.4 million
- The program Internal Services (Note 1**): $243.6 million
- The sub-program Governance and Management Support: $146.0 million
- The sub-program Resource Management Services: $89.2 million
- The sub-program Asset Management Services: $8.4 million
- The program Northern Governance and People: $130.2 million
* Includes $26 million in non-budgetary expenditures (i.e. loans)
**Note 1: Internal Services are comprised of $174.5 million for Administrative Overhead and $69.1 million for Litigation Support/Out-of-Court Settlements.
Source: 2014-15 Main Estimates; additional details at sub-activity level extracted from departmental budget allocations.
Figures may not add due to rounding.
Please refer to the Department's 2014-15 Report on Plans and Priorities
Expenditure Trend – Education
Text description of Expenditure Trend – Education
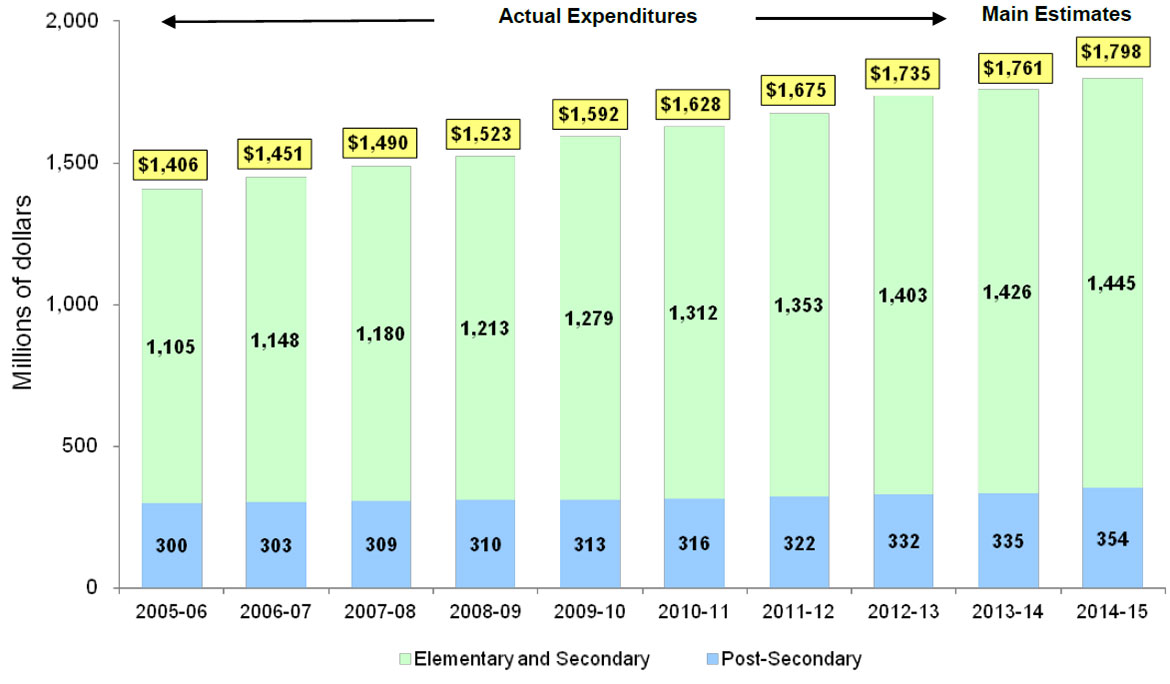
This is an image of a bar graph showing the expenditures made annually by the department for education, broken down for each year into expenditures for elementary and secondary education, and for post-secondary education, from fiscal years 2005-06 to 2014-15. These amounts are based on actual budgetary expenditures (2005-06 to 2012-13) and Main Estimates (2013-14 and 2014-15).
For 2005-06 a total of $1,406 million was spent on education, with $1,105 million spent for elementary and secondary education and $300 million for post-secondary education.
For 2006-07 a total of $1,451 million was spent on education, with $1,148 million spent for elementary and secondary education and $303 million for post-secondary education.
For 2007-08 a total of $1,490 million was spent on education, with $1,180 million spent for elementary and secondary education and $309 million for post-secondary education.
For 2008-09 a total of $1,523 million was spent on education, with $1,213 million spent for elementary and secondary education and $310 million for post-secondary education.
For 2009-10 a total of $1,592 million was spent on education, with $1,279 million spent for elementary and secondary education and $313 million for post-secondary education.
For 2010-11 a total of $1,628 million was spent on education, with $1,312 million spent for elementary and secondary education and $316 million for post-secondary education.
For 2011-12, a total of $1,675 million was spent on education, with $1,353 million spent for elementary and secondary education and $322 million for post-secondary education.
For 2012-13, a total of $1,735 million was spent on education, with $1,403 million spent for elementary and secondary education and $332 million for post-secondary education.
For 2013-14, the Main Estimates indicate a total of $1,761 million will be spent on education, with $1,426 million spent for elementary and secondary education and $335 million for post-secondary education.
For 2014-15, the Main Estimates indicate a total of $1,798 million will be spent on education, with $1,445 million spent for elementary and secondary education and $354 million for post-secondary education.
Overall, actual expenditures for education have increased by about 23% over the period 2005-06 to 2012-13 (or by about 3.1% annually)
Source: 2005-06 to 2012-13 as per Departmental Performance Reports (2005-06 to 2010-11 restated); 2013-14 and 2014-15 as per Main Estimates. Note – to be consistent with figures displayed for 2011-12 and future years, figures originally reflected in DPRs for the period 2005-06 to 2010-11 have been restated to reflect the transfer of funding for Education Agreements to the Treaty Management program (as per the revised Program Alignment Architecture for 2011-12; note – the Treaty Management program has been renamed Management and Implementation of Agreements and Treaties under the revised Program Alignment Architecture for 2014-15) and the consolidation of Cultural Education Centres and First Nations and Inuit Youth Employment Strategy in Elementary and Secondary Education (as per the revised Program Alignment Architecture for 2012-13). In addition, an adjustment has also been made to the DPR figures for the period 2005-06 through 2008-09 to provide consistency with the display of Internal Services as a separate program beginning in 2009-10 (ie. Internal Services was previously attributed across all programs).
Figures may not add due to rounding.
Expenditure Trend – Social Development
Text description of Expenditure Trend – Social Development
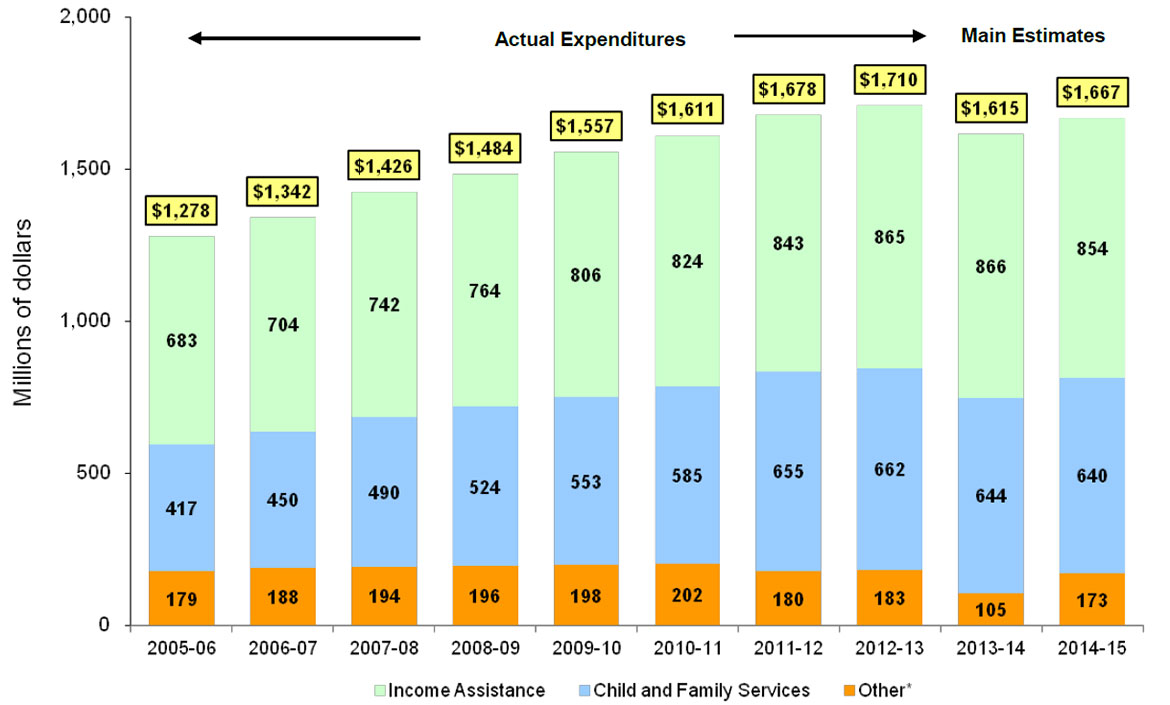
This is an image of a bar graph showing the expenditures made annually by the department for social development, broken down for each year into expenditures for income assistance, child and family services, and other, from fiscal years 2005-06 to 2014-15. These amounts are based on actual budgetary expenditures (2005-06 to 2012-13) and Main Estimates (2013-14 and 2014-15).
For 2005-06 a total of $1,278 million was spent on social development, with $683 million spent on income assistance, $417 million for child and family services, and $179 million for other social development programs and initiatives.
For 2006-07 a total of $1,342 million was spent on social development, with $704 million spent on income assistance, $450 million for child and family services, and $188 million for other social development programs and initiatives.
For 2007-08 a total of $1,426 million was spent on social development, with $742 million spent on income assistance, $490 million for child and family services, and $194 million for other social development programs and initiatives.
For 2008-09 a total of $1,484 million was spent on social development, with $764 million spent on income assistance, $524 million for child and family services, and $196 million for other social development programs and initiatives.
For 2009-10 a total of $1,557 million was spent on social development, with $806 million spent on income assistance, $553 million for child and family services, and $198 million for other social development programs and initiatives.
For 2010-11 a total of $1,611 million was spent on social development, with $824 million spent on income assistance, $585 million for child and family services, and $202 million for other social development programs and initiatives.
For 2011-12, a total of $1,678 million was spent on social development, with $843 million spent on income assistance, $655 million for child and family services, and $180 million for other social development programs and initiatives.
For 2012-13, the Main Estimates indicate a total of $1,710 million will be spent on social development, with $865 million spent on income assistance, $662 million for child and family services, and $183 million for other social development programs and initiatives.
For 2013-14, the Main Estimates indicate a total of $1,615 million will be spent on social development, with $866 million spent on income assistance, $644 million for child and family services, and $105 million for other social development programs and initiatives.
For 2014-15, the Main Estimates indicate a total of $1,667 million will be spent on social development, with $854 million spent on income assistance, $640 million for child and family services, and $173 million for other social development programs and initiatives.
* For the period 2005-06 to 2010-11, Other includes Assisted Living, Family Violence Prevention, National Child Benefit Re-investment and Family Capacity Initiatives; beginning in 2011-12, Family Capacity Initiatives are included in the Child and Family Services sub-program, pursuant to the revised Program Alignment Architecture.
Overall, actual expenditures for social development have increased by about 34% over the period 2005-06 to 2012-13 (or by about 4.3% annually)
Source: 2005-06 to 2012-13 totals as per Departmental Performance Reports (2005-06 to 2008-09 restated); 2013-14 and 2014-15 as per Main Estimates. Note – to be consistent with figures displayed for 2009-10 and future years, figures originally included in DPRs for the period 2005-06 to 2008-09 have been restated to reflect the display of Internal Services as a separate program beginning in 2009-10 (ie. Internal Services was previously attributed across all programs).
Figures may not add due to rounding.
Expenditure Trend – Infrastructure and Capacity
Text description of Expenditure Trend - Infrastructure and Capacity
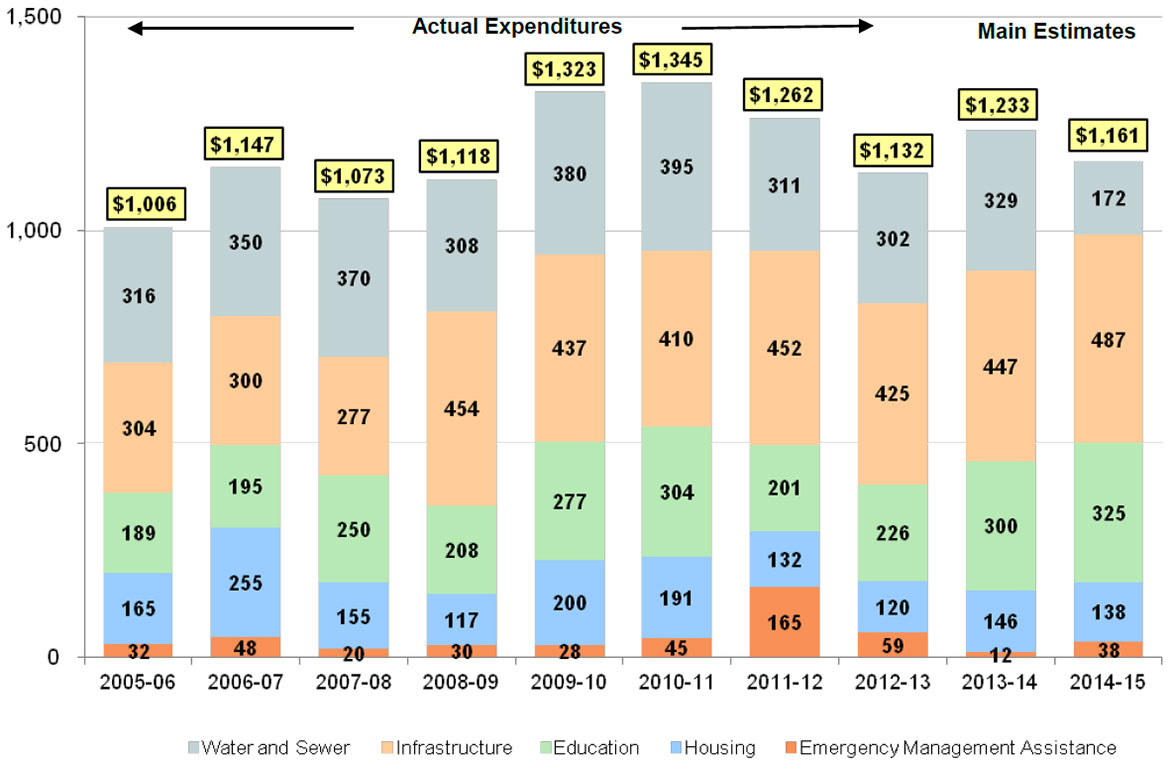
This is an image of a bar graph showing the expenditures made annually by the department for community infrastructure, broken down for each year into expenditures for water and sewage, infrastructure, education, housing, and emergency management assistance from fiscal years 2005-06 to 2014-15. These amounts are based on actual budgetary expenditures (2005-06 to 2012-13) and Main Estimates (2013-14 and 2014-15).
For 2005-06 a total of $1,006 million was spent on infrastructure and capacity, with $316 million spent on water and sewage infrastructure, $304 million for infrastructure, $189 million for education infrastructure, $165 million for housing infrastructure, and $32 million for emergency management assistance.
For 2006-07 a total of $1,147 million was spent on infrastructure and capacity, with $350 million spent on water and sewage infrastructure, $300 million for infrastructure, $195 million for education infrastructure, $255 million for housing infrastructure, and $48 million for emergency management assistance.
For 2007-08 a total of $1,073 million was spent on infrastructure and capacity, with $370 million spent on water and sewage infrastructure, $277 million for infrastructure, $250 million for education infrastructure, $155 million for housing infrastructure, and $20 million for emergency management assistance.
For 2008-09 a total of $1,118 million was spent on infrastructure and capacity, with $308 million spent on water and sewage infrastructure, $454 million for infrastructure, $208 million for education infrastructure, $117 million for housing infrastructure, and $30 million for emergency management assistance.
For 2009-10 a total of $1,323 million was spent on infrastructure and capacity, with $380 million spent on water and sewage infrastructure, $437 million for infrastructure, $277 million for education infrastructure, $200 million for housing infrastructure, and $28 million for emergency management assistance.
For 2010-11 a total of $1,345 million was spent on infrastructure and capacity, with $395 million spent on water and sewage infrastructure, $410 million for infrastructure, $304 million for education infrastructure, $191 million for housing infrastructure, and $45 million for emergency management assistance.
For 2011-12, a total of $1,262 million was spent on infrastructure and capacity, with $311 million spent on water and sewage infrastructure, $452 million for infrastructure, $201 million for education infrastructure, $132 million for housing infrastructure, and $165 million for emergency management assistance.
For 2012-13, a total of $1,132 million was spent on infrastructure and capacity, with $302 million spent on water and sewage infrastructure, $425 million for infrastructure, $226 million for education infrastructure, $120 million for housing infrastructure, and $59 million for emergency management assistance.
For 2013-14, the Main Estimates indicate a total of $1,233 million will be spent on infrastructure and capacity, with $329 million spent on water and sewage infrastructure, $447 million for infrastructure, $300 million for education infrastructure, $146 million for housing infrastructure, and $12 million for emergency management assistance.
For 2014-15, the Main Estimates indicate a total of $1,161 million will be spent on infrastructure and capacity, with $172 million spent on water and sewage infrastructure, $487 million for infrastructure, $325 million for education infrastructure, $138 million for housing infrastructure, and $38 million for emergency management assistance.
Overall, actual expenditures for Infrastructure and Capacity have averaged about $1.2 billion annually over the period 2005-06 to 2012-13.
Source: 2005-06 to 2012-13 totals as per Departmental Performance Reports (restated); 2013-14 and 2014-15 as per Main Estimates (2013-14 restated); additional detailed information extracted from the Long-Term Capital Plan. Note – to be consistent with figures displayed for 2014-15, figures originally reflected in DPRs and in the 2013-14 Main Estimates have been restated to reflect the transfer of capital and O&M funding for the James Bay Crees, the Oujé-Bougoumou Crees and the Naskapi bands of Quebec to the Treaty Management program (as per the revised Program Alignment Architecture for 2011-12) and the inclusion of Emergency Management Assistance funding previously reflected under the Federal Administration of Reserve Land/Responsible Federal Stewardship/First Nations Governance over Land, Resources and the Environment programs (as per the revised Program Alignment Architecture for 2014-15). In addition, an adjustment has also been made to the DPR figures for the period 2005-06 through 2008-09 to provide consistency with the display of Internal Services as a separate program beginning in 2009-10 (ie. Internal Services was previously attributed across all programs).
Figures may not add due to rounding
Expenditure Trend – Specific and Special Claims
Text description of Expenditure Trend – Specific and Special Claims
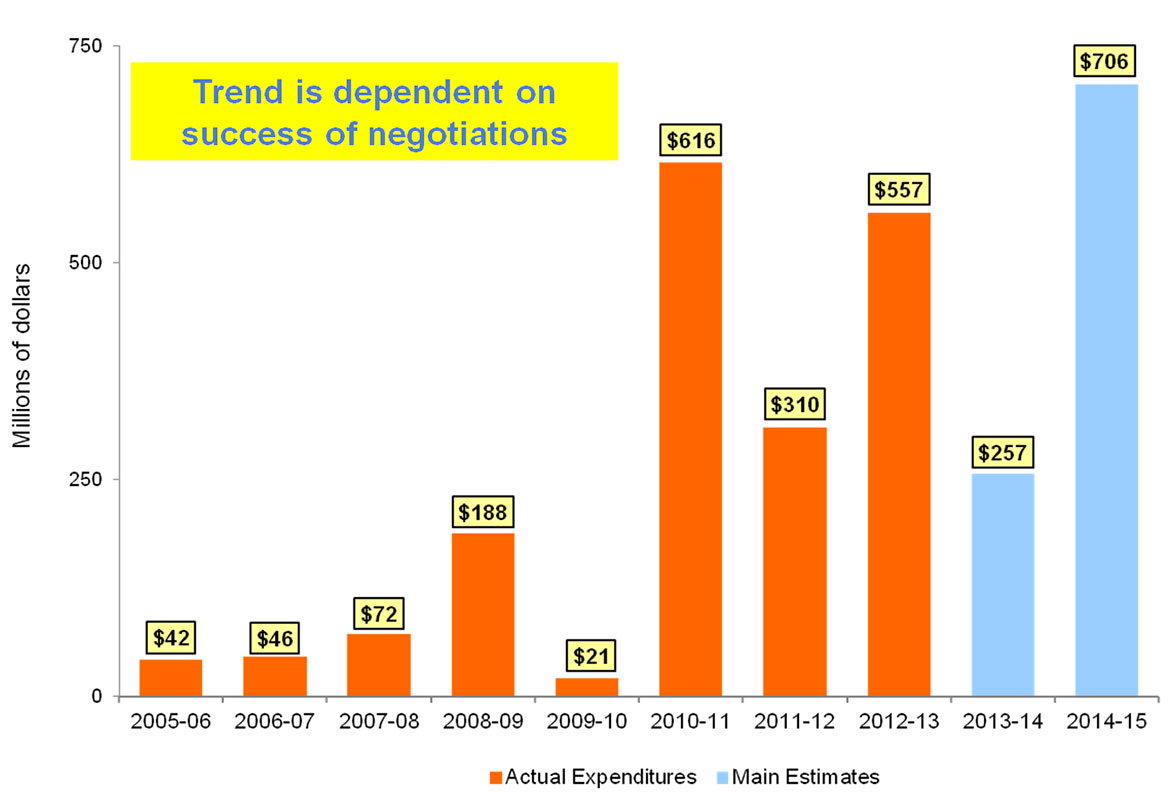
Trend is dependent on success of negotiations
This is an image of a bar graph showing the expenditures made annually by the department for implementation of specific and special claims, from fiscal years 2005-06 to 2014-15. The amounts in this bar graph are based on actual budgetary expenditures (2005-06 to 2012-13) and Main Estimates (2013-2014 and 2014-15).
The figures are as follows: $42 million (2005-06); $46 million (2006-07); $72 million (2007-08); $188 million (2008-09); $21 million (2009-10); $616 million (2010-11); $310 million (2011-12); $557 million (2012-13); $257 million (2013-14); and, $706 million (2014-15).
Please refer to Specific Claims background information and the terms and conditions for grants for specific and special claims for further information.
Program Delivery at AANDC
South of 60°
About 80 per cent of resources are used to fund programs delivered by First Nations community governments, Tribal Councils, etc. Most funds are for basic provincial/municipal type services to individuals on reserve. The federal government is committed to providing services on reserves comparable to those typically provided by the provinces. Provincial standards guide program delivery leading to variability across regions.
North of 60°
Within the federal government, the Minister has the lead responsibility for the North, including the Northern Strategy. The department has a province-like regulatory role in water and oil and gas management. AANDC manages land and resources in Nunavut. This role was devolved to the territorial government in Yukon and North West Territories.
Program Delivery – Demographic Realities
Text description of Distribution of the Aboriginal population by registration status and identity, Canada, 2011
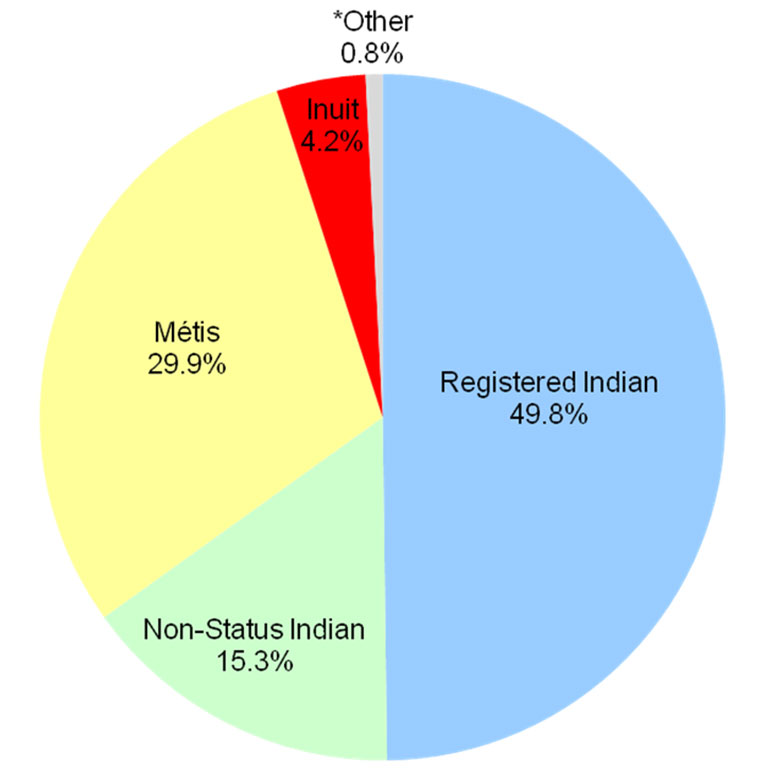
This is an image of a pie chart showing the distribution of the Aboriginal population by registration status and identity as of 2011. The chart indicates that: 49.8% as self-identified as registered Indians; 29.9% as Métis; 15.3% as non-status Indians; 4.2% as Inuit and 0.8% as other.
- According to the 2011 National Household Survey, there are 1,400,685 Aboriginal individuals in Canada, representing 4.3% of the total Canadian population.
- Registered Indians account for just under half of the Aboriginal population.
- In 2011, almost half (46%) of Aboriginal people were less than 25 years of age compared with almost one-third (29%) of non-Aboriginal people.
- The median age for Aboriginal people is 28 years, 13 years less than for non-Aboriginals (41 years).
- The total population of the territories is approximately 105,820 - slightly over half are Aboriginal.
Other refers to respondents who reported more than one identity group, and those who reported being a Band member with no Aboriginal identity and no Registered Indian status.
Source: Statistics Canada, 2011 National Household Survey, AANDC tabulations.
Program Delivery – Geographic Realities (Small Communities)
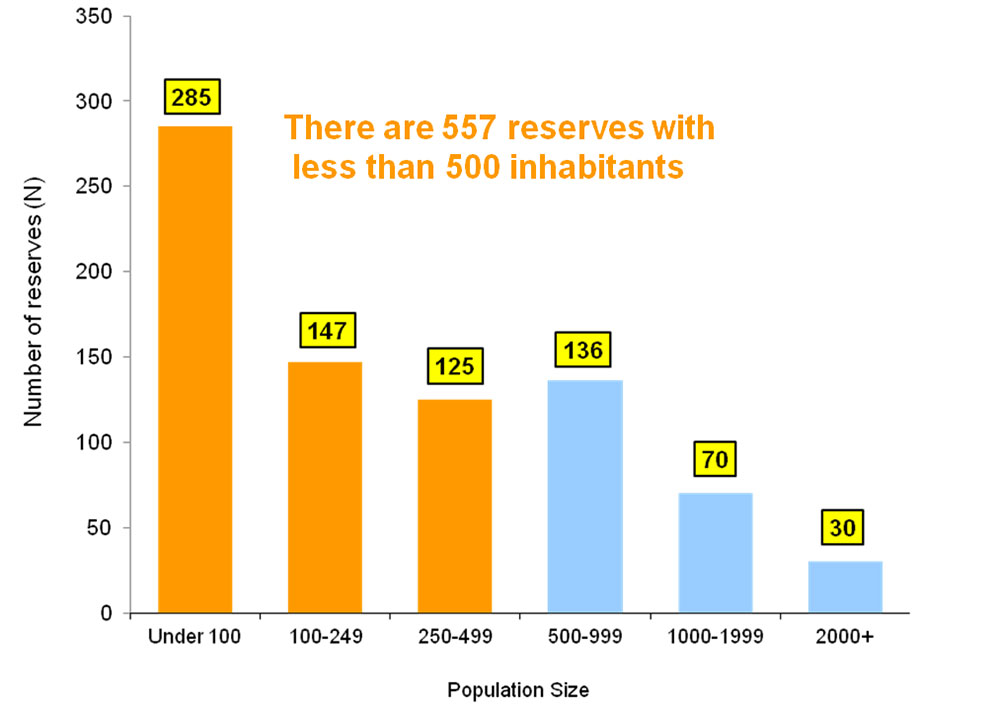
Text description of First Nation Communities by Population Size, 2011
This image is of a bar chart showing the distribution of the 793 First Nation communities by population size based on Statistics Canada 2011 information. The chart indicates that 285 reserves have a population of 100 or less; 147 have populations of between 100 and 249; 125 between 250 and 499; 136 between 500 and 999; 70 between 1000 and 1999 and; 30 with populations of more than 2000. There are 557 reserves with less than 500 inhabitants.
- According to the 2011 Census of Population, 70% of First Nations communities have fewer than 500 inhabitants; the majority are located in British Columbia.
- First Nations communities include legally defined Indian reserves, Indian settlements and other land types created by the ratification of self-government agreements.
Note: N=793 out of a possible 997 First Nation communities delineated by Statistics Canada in 2011. Not included are unpopulated reserves and 31 incompletely enumerated reserves.
Source: AANDC derived from 2011 Geosuite, Statistics Canada.
Program Delivery – Geographic Realities (Dispersed Communities)
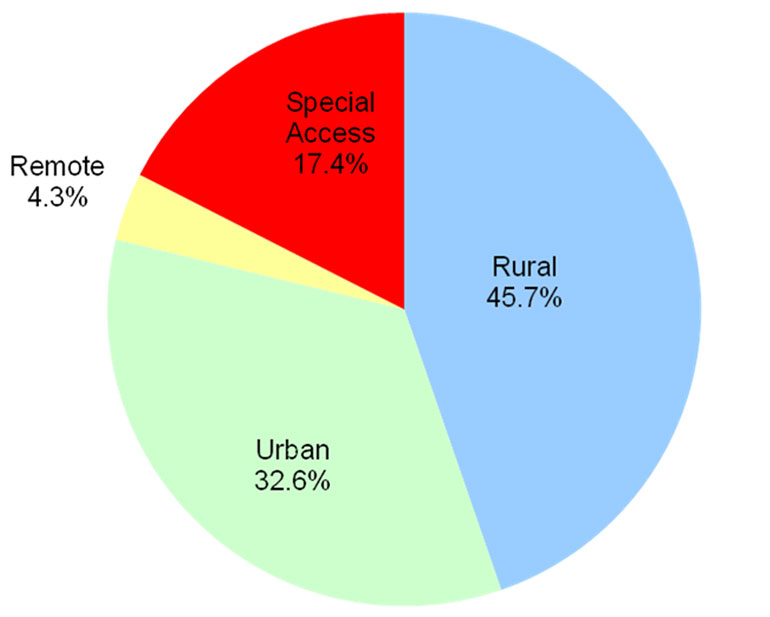
Text description of On-Reserve Population by Geographic Zones, 2013
This image is of a pie chart showing the population distribution by percentage of the on-reserve population by geographic zone. The population distribution is as follows: Rural, 45.7%; Urban, 32.6%; Special Access, 17.4% and; Remote, 4.3%.
As of 2013, 66% of Registered Indians on reserve lived in rural, special access, or remote zones; 34% lived in urban zones.
Note:
- Urban: The First Nation is located within 50 km of the nearest service centre with a year-round road access.
- Rural: The First Nation is located between 50 and 350 km from the nearest service centre with a year-round road access.
- Remote: The First Nation is located over 350 km from the nearest service centre with year-round road access.
- Special Access: The First Nation has no year-round road access to a service centre and, as a result, experiences a higher cost of transportation.
Source: Indian Register Population by Geographic Zone, 2013.
Program Delivery – Socio-Economic Realities
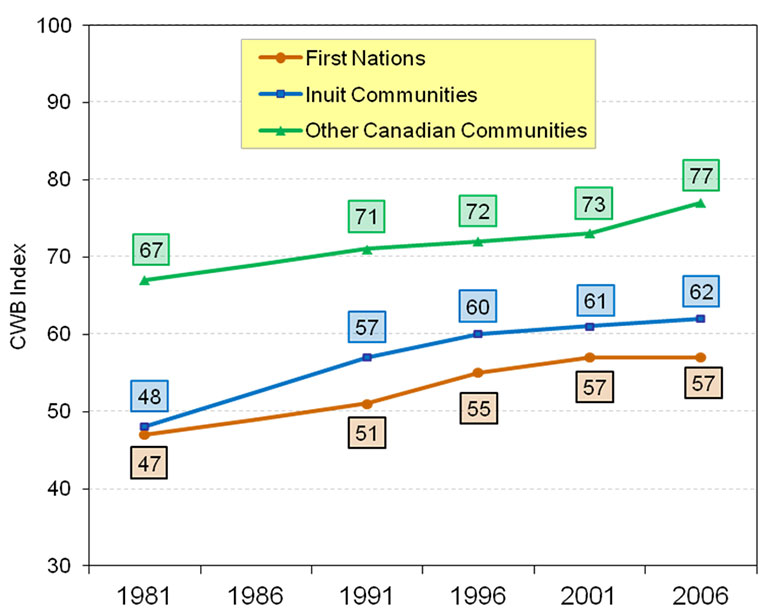
Text description of Community Well-Being Index (CWB), Average CWB Scores, 1981-2006
This image is of a line graph showing the average Community Well-Being scores of First Nation, Inuit and other Canadian communities for the years 1981, 1991, 1996, 2001 and 2006. The Community Well-Being Index is a method of assessing general well-being of Canadians at the community level in terms of education, labour force activity, income and housing. The scores are plotted on an XY axis chart where the "X" axis are the years 1981 to 2006 and the "Y" is the Community Well-Being Index scores from 30 to 100. The chart shows that the scores for First Nation communities were: 47 (1981); 51 (1991); 55 (1996); 57 (2001); 57 (2006). The scores for Inuit communities were: 48 (1981); 57 (1991); 60 (1996); 61 (2001); 62 (2006). The scores for other Canadian communities were: 67 (1981); 71 (1991); 72 (1996); 73 (2001); 77 (2006).
There has been progress over the last 25 years in improving the socio-economic conditions in First Nations and Inuit communities.
A significant gap still exists in the socio-economic conditions of First Nations and Inuit communities compared to those of other communities.
Source: Statistics Canada, 1981, 1991, 1996, 2001 and 2006 Census of Population. The Community Well-Being Index is expected to be updated using the 2011 National Household Survey later this year.
Operating Environment – Economic Action Plan 2014
Economic Action Plan 2014 announced $2.5 billion in total investments for Aboriginal and Northern communities ($138 million in 2014-15 for AANDC), which will allow them to participate more fully in Canada's economy and benefit from its growth. Of the total investment, about $2.4 billion is directed toward Aboriginal Peoples and their communities. The remaining $110 million provides investments for Northerners.
| Total (AANDC + OGDs) | AANDC | Other Government Departments | |||||||||||||
|---|---|---|---|---|---|---|---|---|---|---|---|---|---|---|---|
| Strategic Investments / Committments Announced / Confirmed in Economic Action Plan | 2014-15 | 2015-16 | Total (2 years) | Future Years | Total | 2014-15 | 2015-16 | Total (2 years) | Future Years | Total | 2014-15 | 2015-16 | Total (2 years) | Future Years | Total |
| Aboriginal Peoples | |||||||||||||||
| Reforming First Nations K-12 Education - Comprised of: Core Funding ($1.25 B); Enhanced Education Fund ($160M); Education Infrastructure Fund ($500M) | - | 120.0 | 120.0 | 1,790.0 | 1,910.0 | - | 120.0 | 120.0 | 1,790.0 | 1,910.0 | - | - | - | - | - |
| Supporting First Nation Fishing Enterprises | 33.1 | 33.1 | 66.1 | - | 66.1 | - | - | - | - | - | 33.1 | 33.1 | 66.1 | - | 66.1 |
| Renewing the Aboriginal Justice Strategy | 11.1 | 11.1 | 22.2 | - | 22.2 | - | - | - | - | - | 11.1 | 11.1 | 22.2 | - | 22.2 |
| Addressing Violence Against Aboriginal Women and Girls | - | 5.0 | 5.0 | 20.0 | 25.0 | - | - | - | - | - | - | 5.0 | 5.0 | 20.0 | 25.0 |
| On-Reserve Emergency Management | - | 3.0 | 3.0 | 37.0 | 40.0 | - | 3.0 | 3.0 | 37.0 | 40.0 | - | - | - | - | - |
| Continuing the First Nations Water and Wastewater Action Plan | 161.7 | 161.7 | 323.4 | - | 323.4 | 138.0 | 138.0 | 276.0 | - | 276.0 | 23.7 | 23.7 | 47.4 | - | 47.4 |
| Sub-Total (Aboriginal Peoples) | 205.9 | 333.9 | 539.7 | 1,847 | 2386.7 | 138.0 | 261.0 | 399.0 | 1,827.0 | 2,226.0 | 67.9 | 72.9 | 140.7 | 20.0 | 160.7 |
| Aboriginal and Northern Communities | |||||||||||||||
| Supporting Northern Economic Development | 20.0 | 20.0 | 40.0 | - | 40.0 | - | - | - | - | - | 20.0 | 20.0 | 40.0 | - | 40.0 |
| Developing Transportation Infrastructure in the North (funding to be determined) | - | - | - | - | - | - | - | - | - | - | - | - | - | - | - |
| Territorial Health Investment Fund | 27.0 | 23.0 | 50.0 | 20.0 | 70.0 | - | - | - | - | - | 27.0 | 23.0 | 50.0 | 20.0 | 70.0 |
| Improving Access to Healthy Food for Northerners (funding to be determined) | - | - | - | - | - | - | - | - | - | - | - | - | - | - | - |
| Improving Access to Broadband in Rural and Northern Communities (funding to be determined) | - | - | - | - | - | - | - | - | - | - | - | - | - | - | - |
| Sub-Total (Aboriginal and Northern Communitites) | 47.0 | 43.0 | 90.0 | 20.0 | 110.0 | - | - | - | - | - | 47.0 | 43.0 | 90.0 | 20.0 | 110.0 |
| Other Initiatives that will benefit Aboriginals and Northerners | |||||||||||||||
| Addressing Prescription Drug Abuse in Canada | - | - | - | - | - | - | - | - | - | - | - | - | - | - | - |
| Renewing Arts Funding (e.g. Aboriginal Languages) | - | - | - | - | - | - | - | - | - | - | - | - | - | - | - |
| Sub-Total (Other Initiatives) | - | - | - | - | - | - | - | - | - | - | - | - | - | - | - |
| Total Investments | 252.9 | 376.9 | 629.7 | 1,867 | 2,496.7 | 138.0 | 261.0 | 399.0 | 1,827.0 | 2,226.0 | 114.9 | 115.9 | 230.7 | 40.0 | 270.7 |