Archived - Aboriginal Affairs and Northern Development Canada Quarterly Financial Report - For the Quarter Ended September 30, 2013
Archived information
This Web page has been archived on the Web. Archived information is provided for reference, research or record keeping purposes. It is not subject to the Government of Canada Web Standards and has not been altered or updated since it was archived. Please contact us to request a format other than those available.
1. Introduction
This quarterly financial report has been prepared by management as required by section 65.1 of the Financial Administration Act and in the form and manner prescribed by the Treasury Board. It should be read in conjunction with the Main Estimates and Supplementary Estimates (A) for fiscal year 2013-14 as well as Canada's Economic Action Plan 2013 (Budget 2013). For purposes of both the Main and Supplementary Estimates, the Department is referred to as Indian Affairs and Northern Development.
The quarterly financial report has not been subject to an external audit or review.
1.1 Authority, Mandate and Program Activities
Aboriginal Affairs and Northern Development Canada (AANDC) supports Aboriginal people (First Nations, Inuit and Métis) and Northerners in their efforts to:
- Improve social well-being and economic prosperity;
- Develop healthier, more sustainable communities; and
- Participate more fully in Canada's political, social and economic development – to the benefit of all Canadians.
Further details on AANDC's authority, mandate and program activities can be found in Part II of the Main Estimates and the Report on Plans and Priorities.
1.2 Basis of Presentation
This quarterly report has been prepared by management using an expenditure basis of accounting and a special purpose financial reporting framework designed to meet financial information needs with respect to the use of spending authorities. The accompanying Statement of Authorities includes AANDC's spending authorities granted by Parliament and those used by the Department consistent with the Main Estimates and Supplementary Estimates (A) for the 2013-2014 fiscal year.
The authority of Parliament is required before monies can be spent by the Government. Approvals are given in the form of annually approved limits through appropriation acts or through legislation in the form of statutory spending authority for specific purposes.
As part of the Parliamentary business of supply, the Main Estimates must be tabled in Parliament on or before March 1 preceding the new fiscal year. Budget 2012 was tabled in Parliament on March 29, after the tabling of the Main Estimates on February 28, 2012. As a result the measures announced in the Budget 2012 could not be reflected in the 2012-13 Main Estimates. In fiscal year 2012-2013, frozen allotments were established by Treasury Board authority in departmental votes to prohibit the spending of funds already identified as savings measures in Budget 2012. In 2013-2014, the changes to departmental authorities were reflected in the 2013-2014 Main Estimates tabled in Parliament.
The Department uses the full accrual method of accounting to prepare and present its annual departmental financial statements that are part of the departmental performance reporting process. However, the spending authorities voted by Parliament remain on an expenditure basis.
1.3 AANDC's Financial Structure
The parliamentary vote structure of AANDC is made up of $8.1 billion in budgetary authorities of which $7.9 billion requires approval by Parliament; referred to as voted amounts. The remaining $159.2 million represents statutory authorities that do not require additional approval and are provided for information purposes.
Voted amounts totalling $7.9 billion are split between Operating Expenditures, Capital Expenditures and Grants and Contributions as follows:
- Operating Expenditures represents approximately $1.4 billion (17.9%), this includes $559.8 million (7.1%) for the Settlement Allotment (Independent Assessment Process and Alternative Dispute Resolution) and $160.6 million (2%) for the Assessment, Management and Remediation of Federal Contaminated Sites.
- Capital represents approximately $13.7 million (0.2%)
- Grants and Contributions represent approximately $6.5 billion (82.0%)
More detailed information about AANDC's financial structure, including information about the fiscal cycle, cost drivers, expenditure trends, etc. can be found online.
2. Highlights of Fiscal Quarter and Fiscal Year to Date (YTD) Results
This section highlights the significant items that contributed to the net increase or decrease in resources available for the year and actual expenditures for the quarter ended September 30, 2013. The explanation of variances considers that changes under 5% would have minimal impact on interpretation of results.
2.1 Statement of Authorities (Table 1)
The Quarterly Financial Report reflects the year over year change in authorities for the period from April 1st to September 30th, 2013 and the quarter over quarter change for the period from July 1st to September 30th, 2013. Total year-to-date authorities available for use in the second quarter of 2013-14 were $8,141.1 million compared to $8,035.2 million for the same quarter of the prior year, representing an increase in Departmental Authorities of $105.9 million. The second quarter decrease of $39.5 million over the first quarter in 2013-14 can be explained as follows:
| Program | Increase / (Decrease) in Authorities Available For Use ($ millions) |
||||
|---|---|---|---|---|---|
| Operating * | Capital | Grants and Contributions * |
Non-Budgetary | Total | |
| * Includes statutory authorities ** e.g. Decrease in funding for a new approach to K-12 education for First Nations, Bill C-3 - Gender Equity in Indian Registration Act, Education Information System, Cumulative Impact Monitoring Program, Employee Benefit Plan Adjustment, Consolidation of Pay Services projects in New Brunswick, Mi'kmaq Education, and increase in funding for collective bargaining and Diamond Valuations & Mining Royalty Activities. Note: Figures may not add due to rounding |
|||||
| a. Funding for the Indian Residential Schools Settlement Agreement including funding for awards to claimants resulting from the Independent Assessment Process and Alternative Dispute Resolution as well as funding for the administration and research required to support the federal government's obligations under the agreement | 234.8 | (10.3) | 224.5 | ||
| b. Funding to continue to support the implementation of the First Nations Water and Wastewater Action Plan | 10.3 | 127.1 | 137.4 | ||
| c. Funding for the development of systems and supports to ensure readiness for First Nation education legislation and to support the construction and/or renovation of schools on reserves | 115.0 | 115.0 | |||
| d. Funding to meet increased demand for ongoing Indian and Inuit programs providing access to basic services such as education and social support services | 0.3 | 100.6 | 100.8 | ||
| e. Funding for the assessment, management and remediation of federal contaminated sites | 58.0 | (2.1) | 55.9 | ||
| f. Net decrease in the cash flow for the negotiation, settlement and implementation of specific and comprehensive claims (primarily for the settlement of the Coldwater-Narrows Specific Claim and Justice at Last – Canada's Action Plan on Accelerating the Resolution of Specific Claims) | (15.6) | (9.9) | (290.4) | (8.3) | (324.1) |
| g. Savings identified as part of the Budget 2012 Spending Review | (31.1) | (24.0) | (55.1) | ||
| h. Sunset of funding for First Nations Infrastructure Fund | (53.8) | (53.8) | |||
| i. Decrease reflecting the reform and refocusing of the Income Assistance Program through active measures to increase labour market participation | (40.4) | (40.4) | |||
| j. Other various initiatives (net) ** | (6.9) | 1.6 | (9.4) | (14.8) | |
| 1st Qtr Sub-total increase / (decrease) to Departmental Authorities | 249.8 | (8.3) | (87.8) | (8.3) | 145.4 |
| k. Operating Budget Carry Forward | (38.5) | (38.5) | |||
| l. Capital Budget Carry Forward | (1.0) | (1.0) | |||
| 2nd Qtr Sub-total increase / (decrease) to Departmental Authorities | (38.5) | (1.0) | (39.5) | ||
| Total increase / (decrease) to Departmental Authorities | 211.3 | (9.3) | (87.8) | (8.3) | 105.9 |
As shown in the table above, the $105.9 million increase in total authorities is primarily attributed to the increase of $211.3 million in Operating expenditures, the decrease of $87.8 million in Grants and Contributions and the decrease of $9.3 million in Capital expenditures.
The increase of $211.3 million in Operating expenditures is primarily due to an increase of funding for the Indian Residential Schools Settlement Agreement ($234.8 million) and the assessment, management and remediation of federal contaminated sites ($58 million). This increase is partially offset by the savings identified as part of the Budget 2012 Spending Review ($31.1 million), the decrease in funding for claims activities ($15.6 million) and the decrease related to the Operating Budget Carry Forward which was not received during the second quarter of 2013-14 ($38.5 million).
The decrease of $9.3 million in Capital expenditures is related to Treaty Related Measures funding ($9.9 million) that was reprofiled from 2011-12 to 2012-13 and the Capital Budget Carry Forward ($1 million) which was not received in the second quarter of 2013-14. This decrease was offset by the funding received by the department in 2013-14 for the Canadian High Arctic Research Station and other various initiatives ($1.6 million).
The decrease of $87.8 million in Grants and Contributions is primarily due to a decrease in funding for claims activities ($290.4 million), First Nations Infrastructure Fund ($53.8 million), Income Assistance Program ($40.4 million), and the savings identified as part of the Budget 2012 Spending Review ($24 million). This decrease is partially offset by an increase in funding for First Nations Water and Wastewater Action Plan ($127.1 million), initiatives to improve First Nations Education ($115 million) and ongoing Indian and Inuit programs providing access to basic services ($100.6 million).
2.2 Statement of Departmental Budgetary Expenditures by Standard Object (Table 2)
Highlights of Fiscal Quarter ended September 30, 2013
Departmental spending in the second quarter of 2013-14 was $51.4 million higher than the same period in 2012-13. This net increase of 3.3% can be attributed mainly to an increase of $27.5 million in other subsidies and payments (standard object 12), an increase of $22.2 million in transfer payments (standard object 10) and an increase of $4.7 million in professional and special services (standard object 4). These increases were offset by decreases of $2.2 million in transportation and communications (standard object 2) and $0.8M in rentals (standard object 5).
The increases of $27.5 million in other subsidies and payments and of $4.7 million in professional and special services are a result of timing differences for legal settlement payments as well as Department of Justice billings for legal services provided to the department.
The increase of $22.2 million in transfer payments is primarily attributed to increases in expenditures for education and the First Nations Water and Wastewater Action Plan as well as school construction.
Highlights of Fiscal Year-to-Date (YTD) Results
Year-to-date departmental spending to September 30, 2013 ($3,347 million) is the same as the year-to-date spending for the same time frame last fiscal year ($3,437 million). There was no variance to report.
Year-to-Date Comparison of Budgetary Authorities and Expenditures as of the end of September 2013
($ millions)
View text version of this graph
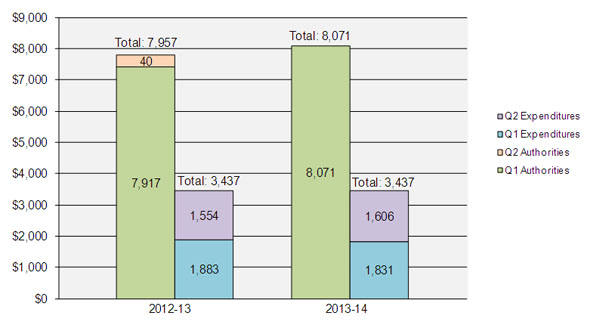
This image is of a bar graph of the year-to-date comparison of budgetary authorities and expenditures as of the end of September 30th, 2013. The graph plots the authorities and expenditures by quarter arriving at a year to date total for the fiscal years 2012-13 and 2013-14.
The 2012-13 data shows the Q2 authorities equaling the Main Estimates, the Supplementary Estimates A authorities, and the Operating Budget Carry Forward arriving at the total authority at the end of Q2 of $7,957M. The 2013-2014 data shows the Q2 authorities equaling the Main Estimates and the Supplementary Estimates A authorities arriving at the total authority at the end of Q2 of $8,071M.
The net difference in comparing the authorities at the end of Q2 each fiscal year is an increase of $114M from 2012-13 to 2013-14.
The second column of each section of the graph pertains to expenditures. The 2012-13 data shows the Q1 expenditures of $1,883M and the Q2 expenditures of $1,554M arriving at a total of $3,437M. The 2013-14 data shows the Q1 expenditures of $1,831M and the Q2 expenditures of $1,606M arriving at a total of $3,437. The net difference in comparing the expenditures at the end of Q2 each fiscal year is $0 from 2012-13 to 2013-14.
3. Risks and Uncertainties
3.1 Risks and Uncertainties
Risk management and risk-based decision-making have become a critical component in the way the Department prioritizes and conducts its business. In the last quarter (September 2013), the Department completed an assessment of its top risks. The process involved a documentation review of existing risk profiles at the program, region and sector levels followed by consultation sessions on each of the nine corporate risk areas. The risk leads were actively involved, summarizing and presenting their assigned risk(s) to their colleagues on the Senior Team Management Team for discussion, then voting. The results of the corporate risk assessment are one of many critical inputs into the Department's annual priority setting exercise.
Environmental Risk and Legal Risk are highest for AANDC in this year's assessment, meaning that the Department has identified these risks as potential areas of concern and will proactively develop mitigation strategies to manage them. Both of these risk areas have significant financial implications for the Department. The Department's legal and operating environments are complex and continually evolving. AANDC is the lead department responsible for the negotiation and implementation of self-government and land claims agreements. Comprehensive land claims agreements and self-government agreements are legally binding, and are given further legal effect through implementing legislation. Many are also constitutionally protected under section 35 of the Constitution Act, 1982. Supreme Court and other court rulings on Aboriginal and treaty rights have a major impact on AANDC's mandate and the way the Department works to fulfill the Crown's legal obligations. Canada's historic relationship with Aboriginal peoples and the ongoing refinement of constitutional concepts and questions add to the complexity of litigation, as well as expose the Government of Canada to landmark court decisions and significant financial liabilities. In an environment of rising costs, the Department is responsible for the long term management of major contaminated sites north of 60 (in particular, the Giant and Faro mines). Regulatory gaps are an issue and the Department also has to consider its role as it supports First Nation communities south of 60, as they pursue economic development opportunities around resource extract and development.
3.2 Risk Mitigating Strategies
Corporate and financial risk mitigation activities are reflected in the Corporate Business Plan and are monitored by senior management on a quarterly basis and modified as required. Cost containment measures are monitored monthly and a review and challenge function is done monthly through the Financial Status Report. A number of practices and internal controls help to manage risk departmentally, including senior management governance and oversight as established through committees, existing policies and procedures that ensure an appropriate level of monitoring, review and reporting.
4. Significant Changes in Relation to Operations, Personnel and Programs
Significant changes in relation to Operations, Personnel and Programs during the second quarter of fiscal year 2013-14 include:
- Riel Bellegarde, Regional Director General, Saskatchewan Region, has left the department for other employment opportunities, effective August 26, 2013.
- Anna Fontaine became the new Regional Director General, Saskatchewan Region, effective September 3, 2013.
- Ian Gray has accepted the responsibilities of the Regional Director General, Nunavut Region effective September 4, 2013.
5. Budget 2012 Implementation
This section provides an update of the savings measures announced in Budget 2012 that are being implemented in order to refocus government and programs; make it easier for Canadians and business to deal with their government; and, modernize and reduce the back office.
Aboriginal Affairs and Northern Development Canada achieved savings of $24.4 million in the first year (2012-13). Savings increased to $55.1 million in 2013-14 and will result in ongoing savings of $160.6 million by 2014-15.
For the year-to-date ending September 30, 2013, Budget 2012 impacts on the Department's authorities as approved in the Main Estimates and Supplementary Estimates (A) resulted in a reduction of $55.1 million.
There are no significant financial risks related to Budget 2012 savings for this quarterly financial report. AANDC continues to manage the implementation of Budget 2012 savings through its financial management and monitoring processes.
In the first and second quarters, the Department continued to focus on decreasing the costs of internal operations. Several internal operational changes continued to be implemented in order to deliver efficient, effective and accountable programs for Aboriginal people and Northerners.
AANDC's Implementation Committee, chaired by the Associate Deputy Minister and comprising the Assistant Deputy Ministers and direct reports to the Deputy Minister, continued to provide overall direction, coordination and oversight to all departmental deficit reduction savings implementation activities. The Workforce Management Board also continued to provide oversight on workforce management mechanisms and to ensure consistency and fairness in human resource decisions across the department.
6. Approval by Senior Officials
Approved, as required by the Treasury Board Policy on Financial Resource Management, Information and Reporting:
(Original signed by)
Michael Wernick
Deputy Minister
(Original signed by)
Susan MacGowan
Chief Financial Officer
Statement of Authorities (unaudited) - Table 1
| Fiscal year 2013-2014 | Fiscal year 2012-2013 | ||||||
|---|---|---|---|---|---|---|---|
| Total available for use for the year ending March 31, 2014 * | Expended during the quarter ended September 30, 2013 | Year to date used at quarter-end | Total available for use for the year ending March 31, 2013 ** | Expended during the quarter ended September 30, 2012 | Year to date used at quarter-end | ||
| (thousands of dollars) | |||||||
|
* Including only Authorities available for use and granted by Parliament at quarter-end. ** Including only Authorities available for use and granted by Parliament at quarter-end. Total available for use does not reflect measures announced in Budget 2012. |
|||||||
| Vote | |||||||
| 1 | Operating expenditures | 1,414,328 | 298,192 | 508,006 | 1,208,367 | 270,988 | 480,472 |
| 5 | Capital expenditures | 13,683 | 1,032 | 1,449 | 22,973 | 389 | 815 |
| 10 | Grants and contributions | 6,483,588 | 1,267,882 | 2,836,356 | 6,560,595 | 1,244,017 | 2,863,344 |
| (S) | Budgetary statutory authorities - Operating Expenditures: | ||||||
| Contributions to employee benefit plans | 70,304 | 17,576 | 35,152 | 65,049 | 16,262 | 32,524 | |
| Minister of Aboriginal Affairs and Northern Development – Salary and motor car allowance | 79 | 20 | 36 | 78 | 19 | 39 | |
| Payments to comprehensive claim beneficiaries in compensation for resource royalties | 2,606 | 0 | 674 | 2,591 | 1,126 | 3,376 | |
| Liabilities in respect of loan guarantees made to Indians for Housing and Economic Development | 2,000 | 0 | 0 | 2,000 | 0 | 6 | |
| Grassy Narrows and Islington Bands Mercury Disability Board | 15 | 0 | 0 | 15 | 0 | 0 | |
| Other | 0 | 1,655 | 1,955 | 0 | 777 | 1,346 | |
| (S) | Budgetary statutory authorities - Transfer Payments: | ||||||
| Grants to Aboriginal organizations designated to receive claim settlement payments pursuant to Comprehensive Land Claim Settlement Acts | 73,762 | 19,671 | 51,746 | 75,576 | 21,033 | 53,569 | |
| Grant to the Nunatsiavut Government for the implementation of the Labrador Inuit Land Claims Agreement pursuant to the Labrador Inuit Land Claims Agreement Act | 8,994 | 0 | 0 | 17,987 | 0 | 0 | |
| Indian Annuities Treaty payments | 1,400 | (339) | 1,783 | 1,400 | (349) | 1,837 | |
| Total Budgetary Authorities | 8,070,760 | 1,605,689 | 3,437,157 | 7,956,631 | 1,554,262 | 3,437,328 | |
| Non-Budgetary Authorities: | |||||||
| Loans to native claimants | 39,903 | 4,397 | 5,077 | 47,403 | 4,684 | 4,684 | |
| Loans to First Nations in British Columbia for the purpose of supporting their participation in the British Columbia Treaty Commission Process | 30,400 | 8,926 | 9,751 | 31,200 | 7,337 | 9,616 | |
| Total Non-Budgetary Authorities | 70,303 | 13,323 | 14,829 | 78,603 | 12,021 | 14,300 | |
| Total Authorities | 8,141,063 | 1,619,012 | 3,451,986 | 8,035,234 | 1,566,283 | 3,451,628 | |
Departmental Budgetary Expenditures by Standard Object (unaudited) - Table 2
| Fiscal year 2013-2014 | Fiscal year 2012-2013 | ||||||
|---|---|---|---|---|---|---|---|
| Planned expenditures for the year ending March 31, 2014 | Expended during the quarter ended September 30, 2013 | Year to date used at quarter-end | Planned expenditures for the year ending March 31, 2013 * | Expended during the quarter ended June 30, 2012 | Year to date used at quarter-end | ||
| (thousands of dollars) | |||||||
| * Planned expenditures do not reflect measures announced in Budget 2012. | |||||||
| Expenditures: | |||||||
| 1 | Personnel | 474,431 | 120,074 | 242,473 | 436,074 | 119,718 | 240,179 |
| 2 | Transportation and communications | 40,699 | 5,740 | 9,330 | 48,907 | 7,946 | 11,967 |
| 3 | Information | 17,728 | 3,204 | 4,029 | 11,351 | 3,642 | 5,456 |
| 4 | Professional and special services | 344,669 | 43,654 | 59,834 | 285,729 | 38,909 | 53,398 |
| 5 | Rentals | 10,460 | 2,548 | 3,697 | 10,802 | 3,341 | 4,333 |
| 6 | Purchased repair and maintenance | 3,521 | 261 | 318 | 5,937 | 281 | 380 |
| 7 | Utilities, materials and supplies | 7,309 | 966 | 1,357 | 9,118 | 1,021 | 1,702 |
| 8 | Acquisition of land, buidlings and works | 6,639 | 4 | 4 | 17,114 | 0 | 0 |
| 9 | Acquisition of machinery and equipment | 20,000 | 1,503 | 1,682 | 20,000 | 1,435 | 1,780 |
| 10 | Transfer payments | 6,567,744 | 1,284,656 | 2,859,389 | 6,655,559 | 1,262,413 | 2,916,463 |
| 12 | Other subsidies and payments | 578,311 | 143,079 | 255,044 | 456,040 | 115,556 | 201,670 |
| Total gross budgetary expenditures | 8,071,510 | 1,605,689 | 3,437,157 | 7,956,631 | 1,554,262 | 3,437,328 | |
| Less: | |||||||
| Revenues netted against expenditures: | (750) | 0 | 0 | 0 | 0 | 0 | |
| Total Revenues netted against expenditures: | (750) | 0 | 0 | 0 | 0 | 0 | |
| Total net budgetary expenditures | 8,070,760 | 1,605,689 | 3,437,156 | 7,956,631 | 1,554,262 | 3,437,328 | |