Air quality monitoring at Giant Mine
Giant Mine's Air Quality Monitoring Program provides data to ensure remediation activities at Giant Mine will not cause adverse effects to people or the environment.
On this page
Air Quality Monitoring Program
Giant Mine's air quality monitoring program provides information that helps protect people and the environment from work happening on site. If one of the air monitors detects an unusual spike in airborne dust levels, site workers take action. This could mean watering the area to keep the dust down, or even stopping the work. While dust from the site may not be harmful to human health, the Project team wants to ensure that dust does not from reach communities near the Giant Mine site.
The Program includes a network of community and fenceline monitoring stations. This network provides air quality information related to site activities to see if they affect local air. The information allows the Project team to ensure residents are not exposed to unacceptable levels of contaminants. It also helps the team know whether dust in the communities is from the site.
As part of the Program, air quality monitors are set up
- in the nearby communities
- around the perimeter of the Giant Mine site (called the "fenceline")
- around specific site activities
The monitors in the communities and at Giant Mine's fenceline are, together, called the "site-wide" network. Another set of monitors is put around specific areas of work on the site. This is called the "activity-specific" network.
The site-wide program provides real-time air quality data related to onsite activities. Real-time means at the very time the process is happening. This helps ensure residents are not exposed to unacceptable levels of contaminants from work happening at site.
Some stations also monitor onsite activities to help decide what actions may be necessary to control dust where work is happening. The number of monitors depends on what work is being done. Some monitors remain in place, while others move based on wind direction. To date, monitored activities include
In the unlikely event the Project team identifies an urgent risk, they will implement the Emergency Response Plan. This plan includes information about communicating during any emergencies so residents stay safe and informed. If needed, the City of Yellowknife and other first responders will provide extra support. More information about emergency planning.
Air quality data from the community stations is available in live format on the Government of the Northwest Territories (GNWT) NWT Air Quality Monitoring Network. Weekly summaries from our other monitoring stations are available there.
What is the Air Quality Monitoring Program measuring?
The Project team measures concentrations of airborne contaminants so they can take action to avoid impacts on human health or the environment. They measure:
- arsenic trioxide dust
- asbestos
- antimony
- iron
- lead
- nickel
- airborne dust, including total suspended particulate (TSP), particulate matter 10 (PM10) and particulate matter 2.5 (PM2.5)
The naming of PM10 and PM2.5 is a representation of their size, measured in microns. PM10 has diameter of 10 microns (µm) or less. PM2.5 has a diameter of 2.5 microns or less. PM2.5 is often present when something is burning. A micron measures one-millionth of a metre. A single micron of any substance is so small it is barely visible. The average human hair, for example, is about 100 microns wide.
TSP is the amount of airborne dust with particles measuring 100 microns or less in diameter. Both PM10 and PM2.5 are types of TSP. By determining the amount of airborne dust, TSP indicates overall air quality. Sources of TSP include:
- construction activities
- vehicle emissions
- road dust
- incineration
TSP includes both dust particles a person can breathe in, as well as larger dust particles that the body's protective systems can easily remove. Depending on its contents, TSP may not cause adverse health effects.
If the TSP mostly contains larger particles, it is not considered a significant health risk. This is because the body's protective systems can remove the particles or keep them from getting into people's bodies. However, if the TSP contains a large amount of respirable particles such as PM10 and PM2.5, it could cause adverse health effects.
TSP is measured in microns per cubic metre, or µ/m3. While TSP is an indicator of total particulate in the air, PM10 is the fraction of that particulate that can be inhaled into the lungs. TSP provides an indication of overall air quality, and PM10 indicates more specifically the presence of particles that could cause adverse health effects. Some amount of TSP in the air is normal, so the monitors are set to look for spikes in their readings.
Airborne particulate doesn't necessarily contain arsenic trioxide or other mining by-products. If inhaled, however, particles of 10 microns or smaller (PM10) may pass through protective hairs in the nose and deep into the lower area of the lungs. This is called "respirable dust". Respirable dust can cause adverse effects on human health, such as reduced heart or lung function. Examples include
- wood smoke
- pollen
- hair
- fibres
- road dust.
The Project team measures TSP, PM10 and PM2.5 as part of two specific air quality monitoring programs:
- the site-wide network, which includes fenceline and community stations
- activity-specific monitoring.
Site-wide network
Fenceline monitors
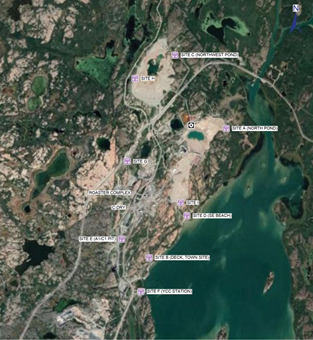
Nine fenceline monitors are set up around the Giant Mine site. They run non-stop during on-site work hours, from around 7 a.m. to 7 p.m. Monday through Saturday during the months the site is not under snow-cover. Stations B, D, E and F are along the south, southeast end of the mine site. Station A is at the northeast end of the site. Station C is near the northernmost point of the site. These monitors check dust concentrations around the borders of the mine site.
The fenceline program measures the air quality identify if dust and contaminants release from the site. It also helps the Project team measure air quality in the nearby communities to make sure dust and contaminants stay below the amounts set by health guidelines.
If these set amounts exceed Health Canada guidelines, the Project team takes action to bring the levels back down. These levels are set at 159 micrograms per cubic metre for PM10 or 333 micrograms per cubic metre for Total Suspended Particulate over a 15 minute period. These levels are lower than would be dangerous to humans or the environment. This way, the team can take action to stop the dust before reaching unsafe levels. Actions the team takes may include:
- spraying dust suppressant
- altering work practices in order to keep the dust down
A change in air quality around Yellowknife is not always from work happening on the site. For example, smoke from forest fires, road dust, and ice fog can cause the fenceline monitors to reach the action level.
Whenever monitors surpass the set levels, site workers investigate the cause of the higher reading. To see if something on site caused the levels, they:
- do visual checks for dust
- review activities happening on site
- look at how strong the wind is blowing
- look at what the direction the wind is blowing
- check other environmental factors like forest fires that could impact air quality
If work on site causes the dust readings, staff takes action to address it right away.
When conditions are extremely smoky from things such as forest fires, the project team is even more vigilant in watching for activities that create dust and taking action to prevent dust.
Community Network
The community monitors ensure the fenceline monitors are effective and that dust does not release from the site. When the community monitors stay within acceptable limits, it shows air quality in the community is within the acceptable levels set by health and environmental experts. If the fenceline monitors are within acceptable levels when the community monitors show spikes, the Project team knows the source of dust is not the Giant Mine site. More information on determining the source of dust.
Three air quality monitoring stations make up the community network. The stations are:
- at the Great Slave Sailing Club marina (north of the city)
- in Ndilo (northeast of the city)
- in Moyle Park, in the Niven Lake sub-division of downtown Yellowknife.
The community network measures against the GNWT and Project air quality markers for protecting health. The stations monitor non-stop for two sizes of particulate matter: 10 microns and 2.5 microns in size (PM10 and PM2.5), which is dust that can get into one's lungs.
Samples are collected from community monitoring stations every three days. The Project team sends these samples to a lab to analyze them for:
- arsenic
- antimony
- iron
- lead
- nickel
- asbestos
- particulate (TSP, PM10).
Each filter provides for two types of data. The filter is weighed to find the TSP and PM10. The filter is then sent to be analyzed for metals. Results take approximately two weeks to process. They are then included in the weekly Air Quality Monitoring reports available on the NWT Air Quality Monitoring Network.
Activity-Specific Network
When specific work might cause dust levels to rise, the Project team installs monitors around the work area. The monitors provide air quality data related to onsite activities to:
- monitor concentrations of airborne contaminants
- assess effects on the local air
- establish whether these contaminants are coming from work at the Giant Mine site
- determine if workers need to take action to mitigate the dust
How can the public know if dust is coming from the Giant Mine site?
The fenceline and activity-specific monitors alert the Project Team whenever TSP or PM10 levels meet or surpass a set level called the "action level". As well, the community monitors alert the project team whenever measurements are at or more than set standards for airborne particulate over 24 hours.
These standards come from the Province of Ontario's Ministry of Environment, the strictest in Canada. This information confirms the fenceline program is properly monitoring air quality.
If a monitor indicates dust levels are approaching either the action level or the 24-hour criteria, the project team takes immediate steps to determine whether the dust is related to activities at Giant Mine. They do so by:
- checking the site-wide system
- examining site activities
- considering wind direction and speed
- asking questions such as
- "Is there any visible dust on site?"
- "Are any ongoing site activities potentially producing dust?"
- "Are the monitors working properly?"
- "Is there something else in the air that may have triggered the alarm?"
If the dust is from the site, the Project team takes immediate action to reduce or eliminate it.
The Project Team receives notification when TSP or PM10 levels meet or surpass 333µ/m3, called the "action level". This level was set according to Health Canada criteria. This level is the point the team takes actions to reduce or eliminate the dust to acceptable levels. Actions include:
- informing all members of the Project Team about air quality monitoring data and wind conditions
- dust suppression such as watering the area or applying calcium chloride to control dust
- modifying, reducing, or even stopping work activities
The air quality monitoring program started in June 2013. Some of the things the program has shown include:
- air quality during the site stabilization work remains at acceptable levels
- particulate matter less than 2.5 and 10 microns remains well within established guidelines except
- when the monitors identify smoke from regional forest fires
- during high winds early in the 2014 work season when the monitor closest to the south tailings pond showed elevated levels and the team took immediate action
- a spike in the spring 2014 that was most likely the result of road dust in Yellowknife.
- arsenic levels remain below the set levels criteria and, in most cases, are so low the laboratory cannot get a measurement
- asbestos and other elements the team measures remains consistently below the set levels