Archived - Aboriginal Affairs and Northern Development Canada Quarterly Financial Report - For the Quarter Ended December 31, 2011
Archived information
This Web page has been archived on the Web. Archived information is provided for reference, research or record keeping purposes. It is not subject to the Government of Canada Web Standards and has not been altered or updated since it was archived. Please contact us to request a format other than those available.
1. Introduction
1.1 Authority, Mandate and Program Activities
Aboriginal Affairs and Northern Development Canada (AANDC) supports Aboriginal people (First Nations, Inuit and Métis) and Northerners in their efforts to:
- Improve social well-being and economic prosperity;
- Develop healthier, more sustainable communities; and
- Participate more fully in Canada's political, social and economic development – to the benefit of all Canadians.
AANDC is one of the federal departments responsible for meeting the Government of Canada's obligations and commitments to First Nations, Inuit and Métis, and for fulfilling the federal government's constitutional responsibilities in the North. AANDC's responsibilities are largely determined by numerous statutes, negotiated agreements and legal decisions.
Most of the Department's programs spending is delivered through partnerships with Aboriginal communities and federal-provincial or federal-territorial agreements. AANDC also works with urban Aboriginal persons, Métis and Non-Status Indians (many of whom live in rural areas) through the Office of the Federal Interlocutor.
The parliamentary vote structure of AANDC is made up of $7.3 billion in budgetary authorities of which $7.1 billion requires approval by Parliament; referred to as voted amounts. The remaining $185.6 million represents statutory forecasts that do not require additional approval and are provided for information purposes and are called statutory authorities. Voted amounts are split between Operating Expenditures, Capital Expenditures and Grants and Contributions. Operating Expenditures represents approximately $1.1 billion (14%), Capital represents approximately $12.2 million (0.2%) and Grants and Contributions represent approximately $6.1 billion (83%) of budgetary authorities.
The quarterly financial report has been prepared by management as required by section 65.1 of the Financial Administration Act and in the form and manner prescribed by the Treasury Board. It should be read in conjunction with the Main Estimates and Supplementary Estimates. For purposes of both the Main and Supplementary Estimates, the Department is referred to as Indian Affairs and Northern Development.
Further details on AANDC's authority, mandate and program activities can be found in Part II of the Main Estimates and the Report on Plans and Priorities.
1.2 Basis of Presentation
This quarterly report has been prepared by management using an expenditure basis of accounting. The accompanying Statement of Authorities includes AANDC's spending authorities granted by Parliament and those used by the Department consistent with the Main Estimates for the 2011-2012 fiscal year. This quarterly report has been prepared by management using an expenditure basis of accounting and a special purpose financial reporting framework designed to meet financial information needs with respect to the use of spending authorities.
The authority of Parliament is required before moneys can be spent by the Government. Approvals are given in the form of annually approved limits through appropriation acts or through legislation in the form of statutory spending authority for specific purposes.
The Department uses the full accrual method of accounting to prepare and present its annual departmental financial statements that are part of the departmental performance reporting process. However, the spending authorities voted by Parliament remain on an expenditure basis.
The quarterly financial report has not been subject to an external audit or review.
2. Highlights of Fiscal Quarter and Fiscal Year to Date (YTD) Results
This section highlights the significant items that contributed to the net increase or decrease in resources available for the year and actual expenditures for the quarter ended December 31, 2011. The explanation of variances considers that changes under 5% would have minimal impact on interpretation of results.
2.1 Statement of Authorities
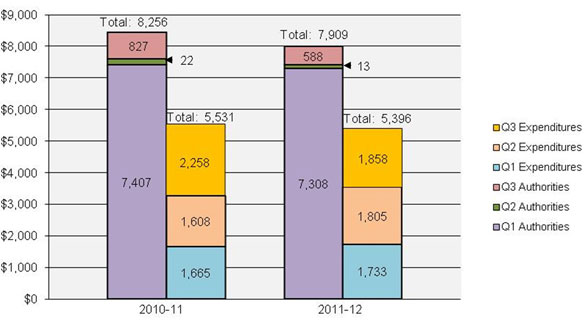
The Quarterly Financial Report reflects the results of the current fiscal period in relation to the Main Estimates and Supplementary Estimates (A) and (B) as well as Operating Budget Carry Forward for the quarter ended December 31, 2011. Total authorities available for use were $7,909 million compared to $8,333 million for the same quarter of the prior year, representing a total decrease of $347 million. This can be explained as follows:
- In the 1st quarter, there was an increase in Main Estimates of $67 million offset by a decrease in Supplementary Estimates (A) of $166 million for a net decrease of $99 million compared to the 1st quarter of the prior year.
- In the 2nd quarter, there was a decrease of $9 million in Operating Budget Carry Forward compared to the 2nd quarter of the prior year.
- In the 3rd quarter, there was a decrease of $239 million in Supplementary Estimates (B) compared to the 3rd quarter of the prior year.
| Program | Amount ($ millions) | |
|---|---|---|
| a. | Implementation of the First Nations Water and Wastewater Action Plan | 159 |
| b. | Funding to support the Federal Government's Obligations resulting from the Indian Residential Schools Settlements Agreement | 155 |
| c. | Funding to meet increase demand for ongoing Indian and Inuit programs providing access to basic services such as education and social support services | 97 |
| d. | Funding for negotiation, settlement and implementation of specific and comprehensive claims | 57 |
| e. | Funding to support the First Nations Infrastructure Fund | 36 |
| f. | Funding to support the First Nations Child and Family Services Program in Manitoba | 35 |
| g. | Various other small programs | 78 |
| h. | Funding from Canada's Economic Action Plan to support investments in First Nations infrastructure | (289) |
| i. | Funding to support the implementation of the new Arctic Research Station | (52) |
| j. | Funding related to the assessment, management and remediation of contaminated sites | (199) |
| k. | Funding for initiatives in support of Canada's clean air agenda | (10) |
| l. | Sub-total increase / (decrease) to Departmental Authorities – Main Estimates | 67 |
| m. | Decrease in Supplementary Estimates A requirements compared to the 1st quarter of the prior year | (166) |
| o. 1st Qtr | Sub-total increase / (decrease) to Departmental Authorities – 1st Quarter | (99) |
| p. 2nd Qtr | Decrease in Operating Budget Carry Forward compared to the 2nd quarter of the prior year | (9) |
| q. 3rd Qtr. | Increase / (decrease) to Departmental Authorities as a result of Supplementary Estimates (B) – 3rd Quarter | (239) |
| r=o+p+q | Total increase / (decrease) to Departmental Authorities | (347) |
In the 3rd quarter, there was a decrease of $239 million in Supplementary Estimates (B) 2011-2012 compared to the 3rd quarter of 2010-11. The main reason for the decrease in authorities from fiscal year 2010-11 to 2011-12 is the Department received incremental funding provided through Supplementary Estimates for specific claims settlements, the settlement of the Treaty Land Entitlement claims submitted by the Bigstone Cree and to implement the Eeyou Marine Region Land Claim Agreement.
As displayed in the Statement of Authorities table, the decrease in total authorities from the previous fiscal year is primarily due to the sunset of funding under Canada's Economic Action Plan ($289 million) and the sunset of funding related to the assessment, management and remediation of federal contaminated sites ($199 million).
2.2 Statement of Departmental Budgetary Expenditures by Standard Object (Table 2)
Highlights of Fiscal Quarter ended December 31, 2011
Departmental spending in the third quarter of 2011-12 resulted in a net decrease of $400M over the same period in 2010-11. This net decrease of 18% can be attributed to: a decrease in Transfer Payments, including Statutory Grant Authorities, of $362M related mainly to the timing of Specific Claims Settlements and a decrease in Professional and Special Services of $52 M related mainly to billings for litigation services pursuant to the Memorandum of Understanding with the Department of Justice that was signed in the second quarter of 2011-12 versus being signed in the third quarter in 2010-11.
These decreases were offset by increases in this quarter of $9M in Personnel costs related mainly to the Public Service Alliance of Canada implementation of payments in lieu of severance pay that will be reimbursed by year-end, an increase of $3M in activities related to other subsidies and payments (standard object 12) such as payments of claimant awards and out of court settlements, an increase of $1M in rentals and an increase of $1M in transportation and communications costs.
Highlights of Fiscal Year-to-Date (YTD) Results
Year-to-date total departmental spending resulted in a decrease of $135M to the end of the third quarter. This decrease is primarily due to activities related to the negotiation and timing of the settlement of specific and comprehensive claims.
3. Risks and Uncertainties
3.1 Risks and Uncertainties
AANDC faces many challenges and opportunities as it strives to deliver its mandate and contribute to the achievement of the Government of Canada's outcomes. The Department's legal and operating environments are complex and continually evolving. AANDC delivers or funds programs and services to diverse groups of people (First Nations, Inuit, Métis and Northerners) who have varied and distinct priorities and needs, and who live in a vast range of communities throughout the country — from remote settlements with extreme climates to metropolitan urban areas. Most of AANDC's services are delivered through partnerships with Aboriginal communities, the provinces and territories, Aboriginal organizations and organizations in the North. AANDC's success is therefore highly dependent on strong and productive relationships.
AANDC's responsibilities are shaped by unique demographic and geographic challenges, as well as centuries of Canadian history. At the same time, the nation's changing social, economic and political landscape strongly influences AANDC's priorities and delivery of services. A key factor in Canada's changing demographic landscape is the growing Aboriginal population, which is young and growing at twice the rate of the Canadian population overall. While this growth brings increasing demands for services, Aboriginal people in Canada continue to exhibit lower levels of education, poorer health and quality of life, and higher levels of unemployment than Canadians overall – it also presents an unprecedented opportunity to harness the potential of capable, educated Aboriginal youth to fill crucial labour shortages now and in the future. In addition, the Department requires an integrated set of plans, policies and programs to foster and build on the economic advancements resulting from the increasing employment opportunities and wealth that is being created by Aboriginal businesses and communities.
AANDC is also the lead department responsible for the negotiation and implementation of self-government and land claims agreements. Comprehensive land claims agreements and self-government agreements are legally binding, and are given further legal effect through implementing legislation. Many are also constitutionally protected under section 35 of the Constitution Act, 1982.
Supreme Court and other court rulings on Aboriginal and treaty rights also have a major impact on AANDC's mandate and the way the Department works to fulfil the Crown's legal obligations. Canada's historic relationship with Aboriginal peoples and the ongoing refinement of constitutional concepts and questions add to the complexity of litigation, as well as expose the Government of Canada to landmark court decisions and significant financial liabilities.
Furthermore, the Arctic region's natural resources are becoming better known, more accessible and more economically feasible to develop. At the same time, this development is raising considerable concern, at home and abroad, about potential negative environmental damage and impacts to traditional lifestyles. Northerners are already experiencing some negative impacts of climate change such as infrastructure damage and changes in species' behaviour. At the same time, changing ice conditions may lead to an increase in marine traffic and generate new economic opportunities for Northerners.
Against the complexities of this operating environment, AANDC encounters a variety of risks. More than ever, risk management is becoming a critical component of managing resources in order to meet departmental objectives. In addition to corporate risk profiling, individual program assessments are being conducted in order to reflect their specific risk contexts.
Taken together, analysis of these risk assessments, including the nine risk areas identified in the 2011 Corporate Risk Profile, indicate a reduction in the overall impact of potential risks – that is, while the risks are more likely to occur, a number of departmental initiatives have lowered the potential impact of these risks should they occur. That said, the Corporate Risk Profile indicates that big challenges continue to be: our ability to retain qualified workforce across the country (Capacity and Capabilities Risk); our ability to harness pertinent information in a timely manner to demonstrate value for money and results (information for Decision-Making Risk); and our ability to implement programs and other key initiatives efficiently and effectively (Implementation Risk).
AANDC's corporate risks are listed in the following table. These corporate risks were assessed by senior management for their likelihood of occurrence and their potential impact relative to the mandate. The results of this risk assessment are plotted on the Risk Heat Map.
| Risk Name | Risk Event: There is a risk that… |
|---|---|
1. HR Capacity and Capabilities Risk |
AANDC will not be able to attract, recruit and retain sufficiently qualified, experienced, and representative human resources in a timely manner. |
2. Information for Decision Making Risk |
AANDC will not make sufficient progress to improve access to timely, pertinent, consistent and accurate information to support planning, resource allocation and programming decisions, monitoring/oversight, and to fulfill accountability, legal and statutory obligations. |
3. Implementation Risk |
AANDC will not be able to create or maintain the necessary systems, management practices and governance rigor to be successful in implementing programs and initiatives. |
4. Resource Alignment Risk |
AANDC's resources will not be well aligned to support the effective and efficient delivery of its mandate. |
5. Government Partnership Risk |
AANDC and its Federal government partners will not effectively and efficiently collaborate in the development and delivery of policies and programs. |
6. Aboriginal Relationship Risk |
AANDC will not build and sustain strong, productive and respectful relationships with Aboriginal people, communities and organizations to contribute to the delivery of its mandate. |
7. External Partnership Risk |
AANDC, provinces, territories, local government, industry, academia and NGOs will not effectively and efficiently partner to contribute to the delivery of its mandate. |
8. Legal Risk |
AANDC will not be able to effectively plan for, or respond to legal risks that impact the activities of the department. |
9. Environmental Risk |
AANDC has not adequately planned for climate change and will not be able to manage its dual responsibility for environmental protection and economic development. |
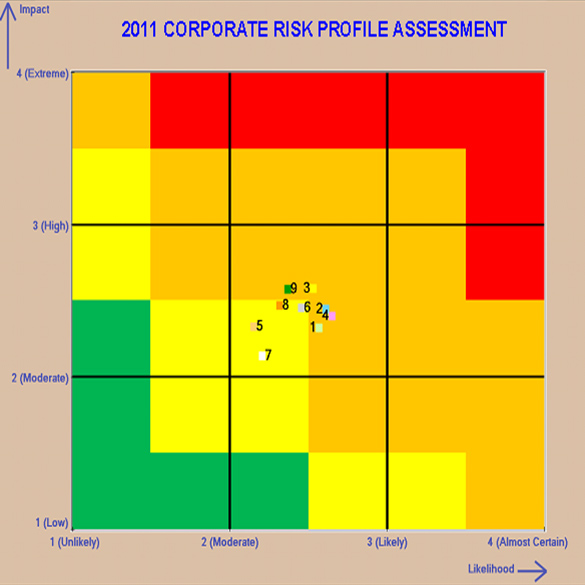
Text alternative for 2011 Corporate Risk Profile Assessment
This image is of the corporate risks plotted on a Risk Heat Map. The map plots each risk by number according to the impact of the risk and likelihood of the risk occurring. The impact value range is low, moderate, high and extreme and the likelihood value range is unlikely, moderate, likely and almost certain.
All risks are plotted towards the center of the map.
The HR Capacity and Capabilities Risk, Information for Decision Making Risk, Implementation Risk, Resource Realignment Risk, Aboriginal Relationship Risk, Legal Risk and Environmental Risk are all plotted closely, midway between moderate to high impact and midway between moderate and likely to occur.
The Government Partnership Risk is plotted as slightly closer to moderate impact and moderate likelihood to occur.
The External Partnership Risk is plotted as the closest to moderate impact and slightly closer to moderate likelihood to occur.
3.2 Risk Mitigating Strategies
Risk mitigating strategies are to be more responsive to the diversity of circumstances among Aboriginal groups and regions. This includes, for example, using more tri-partite based approaches that strengthen Aboriginal and government relationships. Another strategy is the creation of a community development approach that takes into account the varying sizes, resources and levels of political evolution of First Nations.
Budget 2010 announced that departmental operating budgets would be frozen at their 2010-11 level for the fiscal years 2011-2012 and 2012-2013. In order to address resource alignment risks, the Department sets priorities for each fiscal year and monitors expenditures and emerging pressures through regularly reporting in an effort to realign resources as required in a manner that best meets the needs of communities and supports the Department's mandate.
The Department has accommodated the reduction in funding in 2010-11 without significantly impacting its operations. Specific measures adopted by the Department to address constraint measures in 2010-11 and continued into 2011-12 include:
- Freezing the operating budget at 2010-11 levels for fiscal years 2011-12 and 2012-13;
- Any wage and salary increases resulting from collective agreements for 2010-11 and the two following fiscal years are to be absorbed internally within the operating vote. This amounts to approximately $6 million per year; and
- Departmental travel, conference and hospitality spending will remain capped at 2008-09 levels.
4. Significant changes in relation to Operations, Personnel and Programs
Significant changes in relation to Operations, Personnel and Programs during the third quarter of fiscal year 2011-12 include:
- Expenditures related to the Public Service Alliance of Canada implementation of payments in lieu of severance pay.
- Patrick Borbey, the Senior Assistant Deputy Minister, Treaties and Aboriginal Government, was appointed President of the Canadian Northern Economic Development Agency (CANNOR), effective December 19, 2011. Jean-François Tremblay, Senior ADM, Policy and Strategic Direction, will become Senior Assistant Deputy Minister, Treaties and Aboriginal Government, effective April 1, 2012.
- Pursuant to s. 31.1 of the Financial Administration Act and Order-in-Council P.C. 2011-1297 effective November 15, 2011, $9,918,938.58 is deemed to have been appropriated to Shared Services Canada.
5. Approval by Senior Officials
Approved, as required by the Treasury Board Policy on Financial Resource Management, Information and Reporting:
Michael Wernick
Deputy Minister
Susan MacGowan, CMA
Chief Financial Officer
| Fiscal year 2011-2012 (in thousands of dollars) |
Fiscal year 2010-2011 (in thousands of dollars) |
|||||
|---|---|---|---|---|---|---|
| Total available for use for the year ending March 31, 2012* | Used during the quarter ended December 31, 2011 | Year to date used at quarter-end | Planned expenditures for the year ending March 31, 2011* | Expended during the quarter ended December 31, 2010 | Year to date used at quarter-end | |
| * Includes only Authorities available for use and granted by Parliament at quarter-end. Footnote: Pursuant to s. 31.1 of the Financial Administration Act and Order-in-Council P.C. 2011-1297 effective November 15, 2011, $9,918,938.58 is deemed to have been appropriated to Shared Services Canada's Operating Vote, which results in a reduction for the same amount in Aboriginal Affairs and Northern Development Canada's Vote 01, Appropriation Act No. 1, 2011-2012. To date $2,247,313.50 in expenditures have been incurred on behalf of Shared Services Canada by Aboriginal Affairs and Northern Development Canada against Shared Services Canada Operating Vote. |
||||||
| Vote 1 - Operating Expenditures | 1,388,417 | 318,513 | 863,872 | 1,463,753 | 357,359 | 909,088 |
| Vote 5 - Capital Expenditures | 14,770 | 406 | 998 | 11,431 | 0 | 0 |
| Vote 10 - Grants and contributions | 6,320,002 | 1,479,785 | 4,371,240 | 6,617,298 | 1,842,377 | 4,480,483 |
| (S) Budgetary statutory authorities: Operating Expenditures Contributions to employee benefit plans |
71,153 | 18,392 | 54,920 | 66,056 | 17,312 | 51,397 |
Minister of Indian Affairs and Northern Development, Federal Interlocutor for Métis and Non-Status Indians and Mnister of the Canadian Northern Economic Development Agency - Salary and motor car allowance |
78 | 19 | 58 | 79 | 19 | 52 |
| Payments to comprehensive claim beneficiaries in compensation for resource royalties | 2,575 | 46 | 631 | 1,472 | 263 | 1,212 |
| Liabilities in respect of loan guarantees made to Indians for Housing and Economic Development | 2,000 | 0 | 0 | 15 | 0 | 0 |
Grassy Narrows and Islington Bands Mercury Disability Board |
15 | 0 | 0 | 15 | 0 | 0 |
Budgetary statutory authorities - Transfer Payments Grants to Aboriginal organizations designated to receive claim settlement payments pursuant to Comprehensive Land Claim Settlement Acts |
90,416 | 4,055 | 65,430 | 74,437 | 4,055 | 49,004 |
Grant to the Nunatsiavut Government for the implementation of the Labrador Inuit Land Claims Agreement pursuant to the Labrador Inuit Land Claims Agreement Act |
17,987 | 36,715 | 36,715 | 17,987 | 36,715 | 36,715 |
Indian Annuities Treaty payments |
1,400 | (6) | 1,959 | 1,400 | (71) | 1,664 |
Total Budgetary Authorities |
7,908,814 | 1,857,925 | 5,395,824 | 8,255,928 | 2,258,030 | 5,530,572 |
| Non-budgetary authorities | 77,803 | 14,241 | 30,990 | 77,803 | 14,462 | 34,676 |
| Total authorities | 7,986,617 | 1,872,166 | 5,426,814 | 8,333,731 | 2,272,492 | 5,565,248 |
| Fiscal year 2011-2012 (in thousands of dollars) |
Fiscal year 2010-2011 (in thousands of dollars) |
|||||
|---|---|---|---|---|---|---|
| Planned expenditures for the year ending March 31, 2012 |
Expended during the quarter ended December 30, 2011 |
Year to date used at quarter-end | Planned expenditures for the year ending March 31, 2011 |
Expended during the quarter ended December 30, 2010 |
Year to date used at quarter-end | |
| Expenditures: | ||||||
| 01 Personnel | 522,438 | 127,281 | 398,496 | 460,769 | 118,361 | 352,724 |
| 02 Transportation and communications | 70,917 | 12,082 | 26,653 | 67,700 | 11,270 | 31,228 |
| 03 Information | 18,047 | 2,710 | 5,921 | 26,331 | 2,555 | 5,659 |
| 04 Professional and special services | 337,564 | 66,781 | 143,362 | 379,449 | 118,441 | 187,176 |
| 05 Rentals | 15,129 | 2,930 | 6,745 | 14,526 | 2,015 | 6,510 |
| 06 Repair and maintenance | 6,672 | 692 | 1,728 | 7,699 | 801 | 2,367 |
| 07 Utilities, materials and supplies | 11,152 | 1,387 | 3,357 | 10,573 | 1,543 | 3,625 |
| 08 Acquisition of land, buildings and works | 14,977 | 171 | 174 | 11,431 | - | 51 |
| 09 Acquisition of machinery and equipment | 20,000 | 2,020 | 4,476 | 20,000 | 915 | 2,814 |
| 10 Transfer payments | 6,429,805 | 1,520,520 | 4,475,317 | 6,711,121 | 1,883,057 | 4,567,849 |
| 11 Public debt charges | 0 | 0 | 0 | - | - | - |
| 12 Other subsidies and payments | 462,113 | 121,352 | 329,596 | 546,330 | 119,071 | 370,568 |
| Total budgetary expenditures | 7,908,814 | 1,857,926 | 5,395,825 | 8,255,928 | 2,258,029 | 5,530,572 |