Archived - Aboriginal Affairs and Northern Development Canada Quarterly Financial Report - For the Quarter Ended September 30, 2011
Archived information
This Web page has been archived on the Web. Archived information is provided for reference, research or record keeping purposes. It is not subject to the Government of Canada Web Standards and has not been altered or updated since it was archived. Please contact us to request a format other than those available.
1. Introduction
1.1 Authority, Mandate and Program Activities
Aboriginal Affairs and Northern Development Canada (AANDC) supports Aboriginal people (First Nations, Inuit and Métis) and Northerners in their efforts to:
- Improve social well-being and economic prosperity;
- Develop healthier, more sustainable communities; and
- Participate more fully in Canada's political, social and economic development – to the benefit of all Canadians.
AANDC is one of the federal departments responsible for meeting the Government of Canada's obligations and commitments to First Nations, Inuit and Métis, and for fulfilling the federal government's constitutional responsibilities in the North. AANDC's responsibilities are largely determined by numerous statutes, negotiated agreements and legal decisions.
Most of the Department's programs spending is delivered through partnerships with Aboriginal communities and federal-provincial or federal-territorial agreements. AANDC also works with urban Aboriginal persons, Métis and Non-Status Indians (many of whom live in rural areas) through the Office of the Federal Interlocutor.
The parliamentary vote structure of AANDC is made up of $7.3 billion in budgetary authorities of which $7.1 billion requires approval by Parliament; referred to as voted amounts. The remaining $185.6 million represents statutory forecasts that do not require additional approval and are provided for information purposes and are called statutory authorities. Voted amounts are split between Operating Expenditures, Capital Expenditures and Grants and Contributions. Operating Expenditures represents approximately $1.1 billion (14%), Capital represents approximately $12.2 million (0.2%) and Grants and Contributions represent approximately $6.1 billion (83%) of budgetary authorities.
The quarterly financial report has been prepared by management as required by section 65.1 of the Financial Administration Act and in the form and manner prescribed by the Treasury Board. It should be read in conjunction with the Main Estimates and Supplementary Estimates. For purposes of both the Main and Supplementary Estimates, the Department is referred to as Indian Affairs and Northern Development.
Further details on AANDC's authority, mandate and program activities can be found in Part II of the Main Estimates and the Report on Plans and Priorities.
1.2 Basis of Presentation
This quarterly report has been prepared by management using an expenditure basis of accounting. The accompanying Statement of Authorities includes AANDC's spending authorities granted by Parliament and those used by the Department consistent with the Main Estimates for the 2011-2012 fiscal year. This quarterly report has been prepared by management using an expenditure basis of accounting and a special purpose financial reporting framework designed to meet financial information needs with respect to the use of spending authorities.
The authority of Parliament is required before moneys can be spent by the Government. Approvals are given in the form of annually approved limits through appropriation acts or through legislation in the form of statutory spending authority for specific purposes.
The Department uses the full accrual method of accounting to prepare and present its annual departmental financial statements that are part of the departmental performance reporting process. However, the spending authorities voted by Parliament remain on an expenditure basis.
The quarterly financial report has not been subject to an external audit or review.
2. Highlights of Fiscal Quarter and Fiscal Year to Date (YTD) Results
This section highlights the significant items that contributed to the net increase or decrease in resources available for the year and actual expenditures for the quarter ended September 30, 2011. The explanation of variances considers that changes under 5% would have minimal impact on interpretation of results.
2.1 Statement of Authorities
The Quarterly Financial Report reflects the results of the current fiscal period in relation to the Main Estimates and Supplementary Estimates (A) as well as Operating Budget Carry Forward for the quarter ended September 30, 2011. Total authorities available for use were $7,399 million compared to $7,507 million for the same quarter of the prior year, representing a total decrease of $108 million. Even though the 1% change is less than the standard 5% materiality threshold, it is nevertheless explained below. The change is the net effect of the following factors:
- In the 1st quarter, there was an increase in Main Estimates of $67 million offset by a decrease in Supplementary Estimates (A) of $166 million for a net decrease of $99 million compared to the 1st quarter of the previous fiscal year.
- In the 2nd quarter, there was a decrease of $9 million attributable to the Operating Budget Carry Forward when compared to the 2nd quarter of the previous fiscal year.
| Program | Amount ($ millions) | |
|---|---|---|
| a. | Implementation of the First Nations Water and Wastewater Action Plan | 159 |
| b. | Funding to support the Federal Government's Obligations resulting from the Indian Residential Schools Settlements Agreement | 155 |
| c. | Funding to meet increase demand for ongoing Indian and Inuit programs providing access to basic services such as education and social support services | 97 |
| d. | Funding for negotiation, settlement and implementation of specific and comprehensive claims | 57 |
| e. | Funding to support the First Nations Infrastructure Fund | 36 |
| f. | Funding to support the First Nations Child and Family Services Program in Manitoba | 35 |
| g. | Various other small programs | 78 |
| h. | Funding from Canada's Economic Action Plan to support investments in First Nations infrastructure | (289) |
| i. | Funding to support the implementation of the new Arctic Research Station | (52) |
| j. | Funding related to the assessment, management and remediation of contaminated sites | (199) |
| k. | Funding for initiatives in support of Canada's clean air agenda | (10) |
| l. | Sub-total increase / (decrease) to Departmental Authorities – Main Estimates | 67 |
| m. | Decrease in Supplementary Estimates A requirements compared to the 1st quarter of the prior year | (166) |
| o. 1st Qtr | Sub-total increase / (decrease) to Departmental Authorities | (99) |
| p. 2nd Qtr | Decrease in Operating Budget Carry Forward | (9) |
| q=o+p | Total increase / (decrease) to Departmental Authorities | (108) |
2.2 Statement of Departmental Budgetary Expenditures by Standard Object (Table 2)
Highlights of Fiscal Quarter Ended September 30, 2011
Departmental spending in the second quarter of 2011-12 resulted in a net increase of $197M over the same period in 2010-11. This net increase of 12% can be attributed to: an increase in Transfer Payments of $224M related mainly to the timing of Specific Claims Settlements, an increase in Personnel costs of $33M related mainly to the Public Service Alliance of Canada implementation of payments in lieu of severance pay that will be reimbursed by year-end, and an increase in Professional and Special Services of $11M related mainly to billings for litigation services pursuant to the Memorandum of Understanding with the Department of Justice that was signed in the second quarter versus being signed in the third quarter in 2010-11.
These increases were offset by decreases in this quarter of $69M in activities related to other subsidies and payments (standard object 12) such as payments of claimant awards and out of court settlements, and $2M in transportation and communications costs. The decrease of $69M in other subsidies and payments is attributed mainly to the improvements the Resolution and Individual Affairs sector made to their processes during the second quarter of 2010-11, which resulted in the ability to clear a backlog of settlements.
Highlights of Fiscal Year-to-Date (YTD) Results
Year-to-date total departmental spending resulted in an increase of $265M for which $68M is attributable to the first quarter and $197M is attributable to the second quarter. In both instances the increases are primarily due to activities related to the negotiation and settlement of specific and comprehensive claims.
Text alternative for Year-to-Date Comparison of Budgetary Authorities and Expenditures as of the End of September 30th, 2011
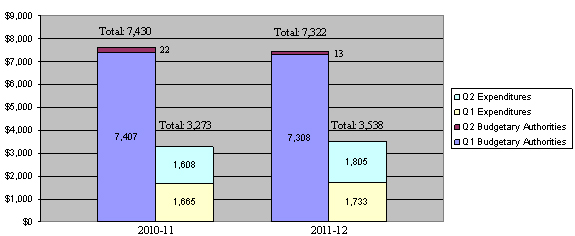
This image is of a bar graph of the year-to-date comparison of budgetary authorities and expenditures as of the end of September 30th, 2011. The graph plots the authorities and expenditures by quarter arriving at a year to date total for the fiscal years 2010-11 and 2011-12.
The 2010-11 data shows the Q1 authorities equaling the Main Estimates of $7,407M and the addition of the Q2 authorities adding $22M to arrive at the total authority at the end of Q2 of $7,430M. The 2011-2012 data shows the Q1 authorities equaling the Main Estimates of $7,308M and the addition of the Q2 authorities adding $13M to arrive at the total authority at the end of Q2 of $7,322M.
The net difference in comparing the authorities at the end of Q2 each fiscal year is a decrease of $108M from 2010-11 to 2011-12. In the 2nd quarter of 2011-12, there was a decrease of $9 million in budgetary expenditures.
The second column of each section of the graph pertains to expenditures. The 2010-11 data shows the Q1 expenditures of $1,665M and Q2 expenditures of $1,608M for a total expenditure at the end of Q2 of $3,273M. The 2011-12 data shows the Q1 expenditures of $1,733M and Q2 expenditures of $1,805M for a total expenditure at the end of Q2 of $3,538M. The net difference in comparing the expenditures at the end of Q2 each fiscal year is an increase of $265M from 2010-11 to 2011-12.
Year-to-date total departmental spending resulted in an increase of $265M for which $68M is attributable to the first quarter and $197M is attributable to the second quarter.
3. Risks and Uncertainties
3.1 Risks and Uncertainties
AANDC's operating and legal environments are complex and continually evolving as the Department funds programs and services to diverse groups of people (First Nations, Inuit, Métis and Northerners) who have varied and distinct priorities and needs, and who live in a vast range of communities throughout the country, from remote settlements with extreme climates to metropolitan urban areas. Further complicating the operating environment is that most of these services are delivered through partnerships with Aboriginal communities, the provinces and territories, Aboriginal organizations and organizations in the North. Many are, in fact, delivered by independent community-based service providers with differing levels of capacity to deliver effectively.
Supreme Court and other court rulings on Aboriginal and treaty rights continue to have a significant impact on the Department's mandate and the way it works to fulfill the Crown's legal obligations. Canada's historic relationship with Aboriginal people and the ongoing refinement of constitutional concepts and questions add to the complexity of litigation, as well as expose the Government of Canada to landmark court decisions and significant financial liabilities. To address its legal risks, the Department has been engaged in a number of activities and initiatives throughout the quarter, including active participation in the Assistant Deputy Minister (ADM) level Interdepartmental Working Group on Legal Risk Management and Integrated Risk Management; negotiation of comprehensive land claims, specific claims and self-government agreements; and continuing its work related to the Federal Contaminated Sites Action Plan.
Unforeseen emergency situations significantly above what would normally be expected and at unprecedented costs, such as the recent forest fires and floods experienced in Alberta, Saskatchewan, Manitoba and Ontario, can be devastating to the health and safety of Aboriginal communities and have a significant impact on the manner in which the Department continues to fulfill its obligations and deliver on its mandate. AANDC has to ensure that it has timely pertinent information for decision making, is capable of responding to such emergency situations and that resources are sourced and properly aligned to support communities at risk while continuing to support the effective and efficient delivery of its mandate.
3.2 Risk Mitigating Strategies
Risk mitigating strategies are to be more responsive to the diversity of circumstances among Aboriginal groups and regions. This includes, for example, using more tri-partite based approaches that strengthen Aboriginal and government relationships. Another strategy is the creation of a community development approach that takes into account the varying sizes, resources and levels of political evolution of First Nations.
Budget 2010 announced that departmental operating budgets would be frozen at their 2010-11 level for the fiscal years 2011-2012 and 2012-2013. In order to address resource alignment risks, the Department sets priorities for each fiscal year and monitors expenditures and emerging pressures through regularly reporting in an effort to realign resources as required in a manner that best meets the needs of communities and supports the Department's mandate.
4. Significant Changes in Relation to Operations, Personnel and Programs
There are three significant changes in relation to Operations, Personnel and Programs during the second quarter of fiscal year 2011-12:
- The expenditures related to the Public Service Alliance of Canada implementation of payments in lieu of severance pay.
- Ms. Françoise Ducros was appointed Assistant Deputy Minister, Education and Social Development Programs and Partnerships on July 7, 2011.
- Mr. Ron Hallman was appointed Senior Assistant Deputy Minister, Regional Operations on August 8, 2011.
5. Approval by Senior Officials
Approved, as required by the Treasury Board Policy on Financial Resource Management, Information and Reporting:
Michael Wernick
Deputy Minister
Susan MacGowan, CMA
Chief Financial Officer
Gatineau, Canada
November 9, 2011
| Fiscal year 2011-2012 (in thousands of dollars) |
Fiscal year 2010-2011 (in thousands of dollars) |
|||||
|---|---|---|---|---|---|---|
| Total available for use for the year ending March 31, 2012* | Used during the quarter ended September 30, 2011 | Year to date used at quarter-end | Total available for use for the year ending March 31, 2011* | Used during the quarter ended September 30, 2010 | Year to date used at quarter-end | |
| * Includes only Authorities available for use and granted by Parliament at quarter-end. | ||||||
| Vote 1 - Operating Expenditures | 1,056,182 | 334,359 | 545,359 | 1,079,126 | 363,557 | 551,729 |
| Vote 5 - Capital Expenditures | 12,194 | 444 | 592 | 6,431 | 0 | 0 |
| Vote 10 - Transfer payments | 6,067,689 | 1,426,763 | 2,891,455 | 6,187,116 | 1,203,962 | 2,638,106 |
| (S) Budgetary statutory authorities: Operating Expenditures | 75,821 | 19,229 | 37,152 | 69,622 | 17,596 | 36,023 |
| (S) Budgetary statutory authorities: Transfer Payments | 109,803 | 24,013 | 63,341 | 87,357 | 22,728 | 46,684 |
| Total Budgetary authorities | 7,321,689 | 1,804,808 | 3,537,899 | 7,429,652 | 1,607,842 | 3,272,541 |
| Non-budgetary authorities | 77,803 | 13,094 | 16,749 | 77,803 | 15,222 | 20,214 |
| Total authorities | 7,399,492 | 1,817,902 | 3,554,648 | 7,507,455 | 1,623,064 | 3,292,755 |
| Fiscal year 2011-2012 (in thousands of dollars) |
Fiscal year 2010-2011 (in thousands of dollars) |
|||||
|---|---|---|---|---|---|---|
| Planned expenditures for the year ending March 31, 2012 |
Expended during the quarter ended September 30, 2011 |
Year to date used at quarter-end | Planned expenditures for the year ending March 31, 2011 |
Expended during the quarter ended September 30, 2010 |
Year to date used at quarter-end | |
| Expenditures: | ||||||
| 01 Personnel | 466,533 | 151,453 | 271,215 | 461,367 | 117,883 | 234,363 |
| 02 Transportation and communications | 56,090 | 9,238 | 14,571 | 60,502 | 11,562 | 19,958 |
| 03 Information | 14,274 | 2,811 | 3,211 | 23,531 | 2,363 | 3,104 |
| 04 Professional and special services | 266,987 | 62,354 | 76,581 | 339,257 | 51,738 | 68,735 |
| 05 Rentals | 11,966 | 2,875 | 3,815 | 12,982 | 3,459 | 4,495 |
| 06 Repair and maintenance | 5,277 | 805 | 1,036 | 6,880 | 1,059 | 1,566 |
| 07 Utilities, materials and supplies | 8,820 | 1,285 | 1,970 | 9,449 | 1,419 | 2,082 |
| 08 Acquisition of land, buildings and works | 12,194 | 3 | 3 | 6,431 | 51 | 51 |
| 09 Acquisition of machinery and equipment | 20,000 | 1,658 | 2,456 | 20,000 | 1,471 | 1,899 |
| 10 Transfer payments | 6,177,492 | 1,450,778 | 2,954,797 | 6,274,473 | 1,226,690 | 2,684,791 |
| 12 Other subsidies and payments | 282,056 | 121,548 | 208,244 | 214,780 | 190,147 | 251,497 |
| Total budgetary expenditures | 7,321,689 | 1,804,808 | 3,537,899 | 7,429,652 | 1,607,842 | 3,272,541 |