Archived - 2011-2012 Financial Overview - March 2011
Archived information
This Web page has been archived on the Web. Archived information is provided for reference, research or record keeping purposes. It is not subject to the Government of Canada Web Standards and has not been altered or updated since it was archived. Please contact us to request a format other than those available.
PowerPoint version (327 Kb, 15 Pages)
PDF format (113 Kb, 15 Pages)
Table of Contents
- Minister's Portfolio ($7.4 billion)
- INAC Program Delivery Context
- Demographic Realities
- Geographic Realities - Small Communities
- Geographic Realities - Dispersed Communities
- Socio-Economic Realities
- Departmental Finances - 2011-12 Main Estimates - Total $7,368 million
- 2011-12 Main Estimates by Sub-Activity – Total $7,368 million
- Growth Rate for Indian and Inuit Programming
- Expenditure Trend - Cumulative % Change 1996-97 to 2011-12
- Annual Estimates Cycle
- Major Cost Drivers
- Financial and Performance Management
- In Summary
Minister's Portfolio ($7.4 billion)
Indian Residential Schools Truth and Reconciliation Commission ($12M) provides an opportunity for those directly or indirectly affected by the legacy of residential school to share their experiences and inform Canadians.
Canadian Northern Economic Development Agency ($44M) helps provide the foundation for a prosperous economic future for those who live, work and support their families in the North. Its primary focus is the provision of integrated business services north of 60.
Indian and Northern Affairs Canada ($7,368M) supports Aboriginal people (First Nations, Inuit and Métis) and Northerners in their efforts to improve social well-being and economic prosperity; develop healthier, more sustainable communities; and participate more fully in Canada's political, social and economic development to the benefit of all Canadians.
Canadian Polar Commission ($1M) has a broad mandate related to promotion, development and dissemination of knowledge on the Polar Regions.
Registry of the Specific Claims Tribunal ($3M) facilitates timely access to the Specific Claims Tribunal; ensures the smooth and efficient functioning of hearings; and safeguards the independence of the Specific Claims Tribunal by placing them at arm's length from the Government of Canada.
First Nations Statistical Institute ($5M) provides First Nations and other stakeholders with timely, accurate, and relevant statistical information that supports program and policy development decisions and fiscal transfers relating to First Nations.
INAC Program Delivery Context
Highly decentralized with 10 regions
South of 60°
- About 80% of resources are used to fund programs delivered by First Nations community governments, Tribal Councils, etc.
- Most funds are for basic provincial/municipal type services to individuals on reserve.
- The federal government is committed to providing services on reserves comparable to those typically provided by the provinces.
- Provincial standards guide program delivery leading to variability across regions.
North of 60°
- The Minister has responsibilities for the North, including the Northern Strategy.
- The Department has a province-like role in water and oil and gas management and a federal-like role in social and economic development.
- Indian and Northern Affairs Canada manages land and resources in Nunavut and the Northwest Territories (Yukon is devolved).
Demographic Realities
- According to the 2006 Census of Population, there are 1,172,785 Aboriginal individuals in Canada, representing 3.8% of the total Canadian population.
- Registered Indians account for over half of the Aboriginal population.
- In 2006, almost half (47.8%) of Aboriginal people were less than 25 years of age compared with almost one-third (30.7%) of non-Aboriginal people.
- The median age for Aboriginal people is 27 years, 13 years less than for non-Aboriginals (40 years).
- The total population of the territories is approximately 101,000 - slightly over half are Aboriginal.
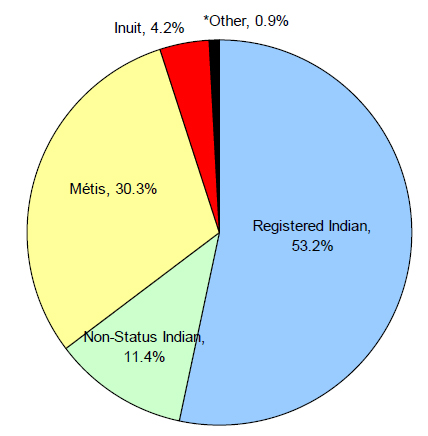
Text description of figure 1 - Distribution of the Aboriginal Population by Registration Status and Identity, Canada, 2006
This is an image of a pie chart showing the distribution of the Aboriginal population by registration status and identity as of 2006. The chart indicates that there were: 53.2% were identified as registered Indians; 30.3% as Métis; 11.4% non-status Indians; 4.2% Inuit and: 0.9% as other ("other" refers to individuals who reported more that one Aboriginal group, and those who reported being a Band member with no Aboriginal identity and no registered Indian status. The sources for the data in the chart are the 2006 Census of Population with tabulations done by Indian and Northern Affairs Canada.
* Other refers to individuals who reported more than one Aboriginal group, and those who reported being a Band member with no Aboriginal identity and no Registered Indian status.
Source: 2006 Census of Population, INAC tabulations.
Geographic Realities - Small Communities
- According to the 2006 Census of Population, 75% of First Nations reserves have less than 500 inhabitants; the majority are located in British Columbia.
- First Nations communities include legally defined Indian reserves, Indian settlements, other land types created by the ratification of self-government agreements, and northern communities affiliated with First Nations.
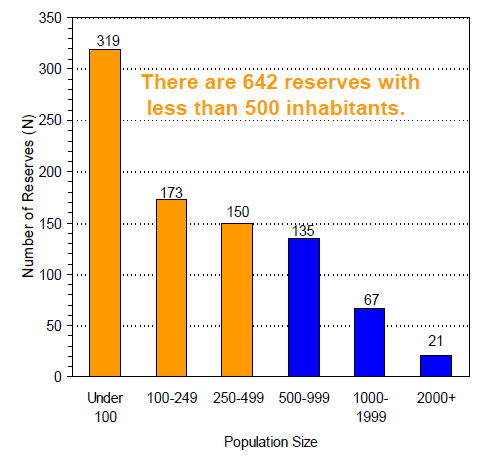
Text description of figure 2 - First Nation Reserves by Population Size, 2006
This image is of a bar chart showing the distribution of the 865 First Nation reserves by population size based on statistics Canada 2006 information. The chart indicates that 319 reserves have a population of 100 or less; 173 have populations of between 100 and 249; 150 between 250 and 499; 135 between 500 and 999; 67 between 1000 and 1999 and; 21 with populations of more than 2000.
Note: N=865 out of a possible 1,176 First Nation communities delineated by Statistics Canada in 2006. Not included are unpopulated reserves and 22 incompletely enumerated reserves that did not participate in the Census.
Source: INAC derived from 2006 Geosuite, Statistics Canada.
Geographic Realities - Dispersed Communities
- As of 2009, 66% of Registered Indians on reserve lived in rural, special access, or remote zones; nearly 34% lived in urban zones.
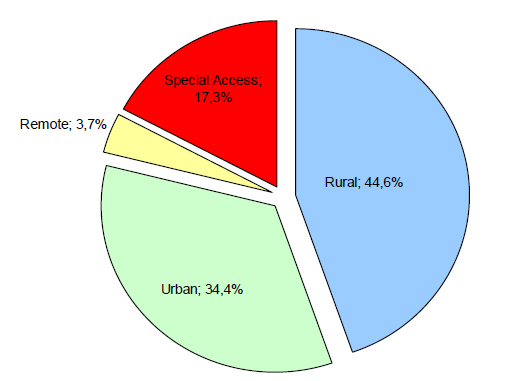
Text description of figure 3 - On - Reserve Population by Geographic Zones, 2009
This image is of a pie chart showing the population distribution by percentage of the on-reserve population by geographic zone. The population distribution is as follows: Rural, 44.6%; Urban, 34.4%; Special Access, 17.3% and; Remote, 3.7%. The definitions for these categories are: Urban: the First Nation is located within 50 km of the nearest service centre with a year-round road access. Rural: the First Nation is located between 50 and 350 km from the nearest service centre with a year-round road access. Remote: the First Nation is located over 350 km from the nearest service centre with year-round road access. Special Access: The First Nation has no year-round road access to a service centre and, as a result, experiences a higher cost of transportation. Source: Indian Register Population by Geographic Zone, 2010.
Notes: Departmental Definitions
Urban: The First Nation is located within 50 km of the nearest service centre with a year-round road access.
Rural: The First Nation is located between 50 and 350 km from the nearest service centre with a year-round road access.
Remote: The First Nation is located over 350 km from the nearest service centre with year-round road access.
Special Access: The First Nation has no year-round road access to a service centre and, as a result, experiences a higher cost of transportation.
Source: Indian Register Population by Geographic Zone, 2010
Socio-Economic Realities
- There has been progress over the last 25 years in improving the socio-economic conditions in First Nations and Inuit communities.
- A significant gap still exists in the socio-economic conditions of First Nations and Inuit communities compared to those of other communities.
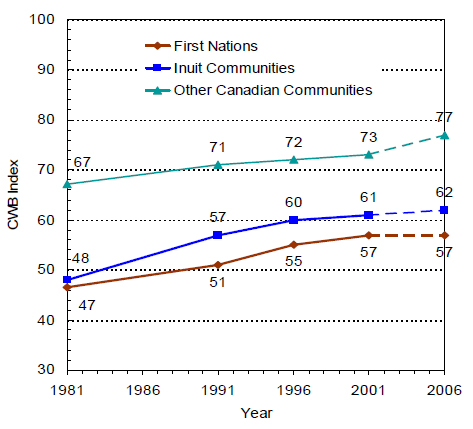
Text description of figure 4 - Community Well-Being Index (CWB) Average
This image is of a line graph showing the average Community Well-Being scores of First Nations, Inuit and other Canadian communities for the years 1981, 1991, 1996, 2001 and 2006. The Community Well-Being Index is a method of assessing general well-being of Canadians at the community level in terms of education, labour force activity, income and housing. The scores are plotted on an XY axis chart where the "X" axis are the years 1981 to 2006 and the "Y" is the Community Well-Being Index scores from 30 to 100. The chart shows that the scores for First Nations communities were: 47 (1981); 51 (1991); 55 (1996); 57 (2001); 57 (2006).
The scores for Inuit communities were: 48 (1981); 57 (1991); 60 (1996); 61 (2001); 62 (2006). The scores for other Canadian communities were: 67 (1981); 71 (1991); 72 (1996); 73 (2001); 77 (2006). The source for the data used in the line is Statistics Canada's Census of Population for 1981, 1991, 1996, 2001, 2006.
Source: Statistics Canada,
1981, 1991, 1996, 2001 and 2006 Census of Population.
Departmental Finances - 2011-12 Main Estimates – Total $7,368 million
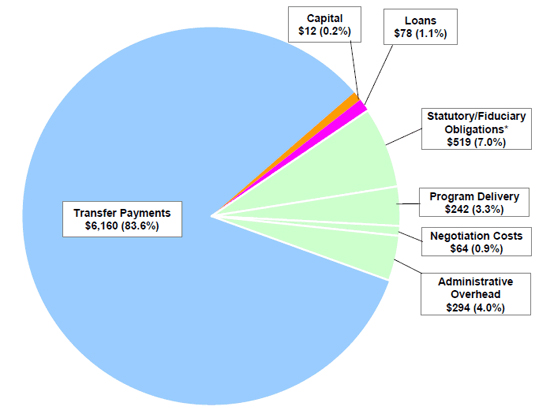
Text description of figure 5 - Departmental Finances - 2011-12 Main Estimates – Total $7,368 million
This image is of a pie chart showing the breakdown of departmental expenditures for 2011-12. The breakdown is shown as follows: $6,160 million (83.6%) transfer payments; $78 million (1.1%) loans; $12 million (0.2%) capital; $519 million (7.0%) statutory/fiduciary obligations; $242 million (3.3%) program delivery; $64 million (0.9%) negotiation costs; $294 million (4.0%) administrative overhead. The major item in the $519M is $391M for obligations stemming from the Indian Residential Schools Settlement Agreement (comprised of $360M for the Independent Assessment Process and $31M in other support). Furthermore, of the $519M, over $300M is for direct payments to recipients including obligations stemming from the Indian Residential Schools Settlement Agreement, claims related obligations, Department of Justice costs, out-of-court settlements, etc.
The source for the information for the chart is the 2011-12 Main Estimates. Figures may not add due to rounding.
* The major item in the $519M is $391M for obligations stemming from the Indian Residential Schools Settlement Agreement (comprised of $360M for the Independent Assessment Process and $31M in other support). Furthermore, of the $519M, over $300M is for direct payments to recipients including obligations stemming from the Indian Residential Schools Settlement Agreement, claims related obligations, Department of Justice costs, out-of-court settlements, etc.
Source: 2011-12 Main Estimates
Figures may not add due to rounding
2011-12 Main Estimates by Sub-Activity – Total $7,368 million
| The Government | Total |
|---|---|
| Governance and Institutions of Government | |
| Sub-Activities | |
| 406.6 | |
| 28.3 | |
| Total | $ 434.9 |
| Co-operative Relationships | |
| Sub-Activities | |
| 191.8 | |
| 282.3 | |
| 2.9 | |
| 1.9 | |
| Total | $ 478.9 |
| Treaty Management | |
| Sub-Activities | |
| 412.2 | |
| 276.2 | |
| 0.9 | |
| Total | $ 689.3 |
| Total | $ 1,603.1 |
| The People | Total |
|---|---|
| Education | |
| Sub-Activities | |
| 1,297.0 | |
| 24.1 | |
| 325.9 | |
| 10.3 | |
| Total | $ 1 ,657.2 |
| Social Development | |
| Sub-Activities | |
| 817.1 | |
| 1.3 | |
| 83.8 | |
| 632.8 | |
| 29.4 | |
| Total | $ 1 ,564.4 |
| Managing Individual Affairs | |
| Sub-Activities | |
| 17.8 | |
| 1.3 | |
| 1.6 | |
| 1.4 | |
| Total | $ 22.1 |
| Residential Schools Resolution | |
| Sub-Activities | |
| 18.2 | |
| 360.2 | |
| 10.2 | |
| 2.6 | |
| Total | $ 391.1 |
| Total | $ 3,634.8 |
| The Land and Economy | Total |
|---|---|
| Aboriginal Economic Development | |
| Sub-Activities | |
| 55.5 | |
| 177.4 | |
| 17.1 | |
| Total | $ 250.0 |
| Federal Administration of Reserve Land | |
| Sub-Activities | |
| 15.2 | |
| 22.6 | |
| Total | $ 37.8 |
| Community Infrastructure | |
| Sub-Activities | |
| 336.2 | |
| 276.6 | |
| 145.8 | |
| 453.5 | |
| 0.1 | |
| Total | $ 1,212.2 |
| Total | $ 1,500.0 |
| The North | Total |
|---|---|
| Northern Governance and People | |
| Sub-Activities | |
| 63.5 | |
| 57.2 | |
| Total | $ 120.7 |
| Northern Science and Technology | |
| Sub-Activities | |
| 5.2 | |
| 5.4 | |
| Total | $ 10.7 |
| Northern Land, Resources and Environmental Management | |
| Sub-Activities | |
| 2.5 | |
| 14.5 | |
| 21.9 | |
| 24.2 | |
| 10.5 | |
| Total | $ 73.6 |
| Total | $ 204.9 |
| Office of the Federal Interlocutor | Total |
|---|---|
| Urban Aboriginal Strategy | $ 13.5 |
| Métis and Non-status Indian Organizational Capacity Development | $ 16.1 |
| Métis Rights Management | $ 11.9 |
| Total | $ 41.5 |
| Internal Services | Total |
|---|---|
| Governance & Management Support | $ 261.7 |
| Resource Management Services | $ 117.7 |
| Asset management Services | $ 4.6 |
| Total | $ 384.0 |
Note 1: Comprised of $294 million for Administrative Overhead and $90 million for Litigation Support.
Source: 2010-11 Main Estimates; additional details at sub-activity level extracted from departmental budget allocations. Figures may not add due to rounding.
Growth Rate for Indian and Inuit Programming
- It is estimated that Indian and Northern Affairs Canada, Health Canada and numerous other federal departments and agencies now spend more than $11 billion each year to fund programs directed to Aboriginal people.
- The department's forecasted expenditures for 2011-12 are over $7 billion.
- The department's approved annual growth rate for Indian and Inuit programming services remains at two percent.
- The overall annual growth rate, however, is larger due to significant investments made in priority areas through successive budgets since 2006 (e.g. education, women, children and families, water, housing and economic development).
- As part of effectively managing its budget, the department actively monitors resource pressures to ensure resources are aligned with priorities, including ensuring that demographic growth pressures and provincially set price increases in education and social development are met.
- To address the pressures that arise from the two percent cap, the department will, when necessary, re-allocate funds from certain program areas to address pressures in other program areas particularly education and social development.
Expenditure Trend - Cumulative % Change 1996-97 to 2011-12*
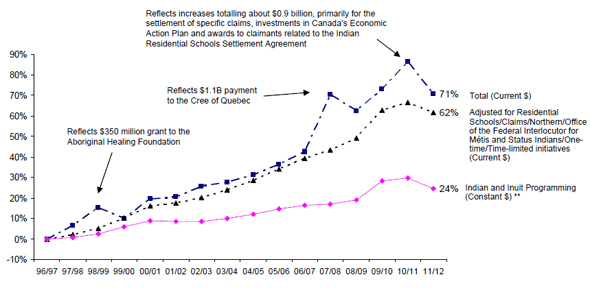
Text description of figure 6 - Expenditure Trend - Cumulative % Change 1996-97 to 2011-12
This image is of a line graph of the cumulative percentage change in departmental expenditures annually from fiscal years 1996-97 to 2011-12. The graphs plots the percentage changes for: total expenditures (current dollars); expenditures adjusted for residential schools, claims, northern, the Office of the Federal Interlocutor for Métis and Status Indians, and one-time/time-limited initiatives; and Indian and Inuit programming (constant dollars derived using the Final Domestic Demand Implicit Price Index). The percentages are based on actual budgetary expenditures (1996-97 to 2009-10), current forecast (2010-11) and Main Estimates (2011-12), as follows:
Total current dollars: (0%) 1996-97; (7%) 1997-98; (15%) 1998-99; (10%) 1999-2000; (20%) 2000-2001; (20%) 2001-02; (26%) 2002-03; (28%) 2003-04; (31%) 2004-05; (37%) 2005-06; (42%) 2006-07; (70%) 2007-08; (62%) 2008-09; (73%) 2009-10; (86%) 2010-11; (71%) 2011-12. It should be noted that the current dollar line reflects a number of sharp increases due to the following: 1998-99 includes a $350 million grant to the Aboriginal Healing Foundation; 2007-08 includes a $1.1 billion payment to the Cree of Quebec; and 2010-11 includes increases totalling about $0.9 billion, primarily for the settlement of specific claims, investments in Canada's Economic Action Plan and awards to claimants related to the Indian Residential Schools Settlement Agreement.
Actual adjusted for Northern Affairs/Claims/Residential Schools/One-time/Time limited: (0%) 1996-97; (2%) 1997-98; (5%) 1998-99; (10%) 1999-2000; (16%) 2000-2001; (18%) 2001-02; (20%) 2002-03; (24%) 2003-04; (28%) 2004-05; (34%) 2005-06; (39%) 2006-07; (43%) 2007-08; (49%) 2008-09; (63%) 2009-10; (67%) 2010-11; (62%) 2011-12.
Indian and Inuit Programming (constant dollars): (0%) 1996-97; (1%) 1997-98; (2%) 1998-99; (6%) 1999-2000; (9%) 2000-2001; (8%) 2001-02; (8%) 2002-03; (10%) 2003-04; (12%) 2004-05; (15%) 2005-06; (16%) 2006-07; (17%) 2007-08; (19%) 2008-09; (28%) 2009-10; (30%) 2010-11; (24%) 2011-12.
* 1996-97 to 2009-10 based on actual budgetary expenditures; 2010-11 based on current forecast; 2011-12 based on Main Estimates
** Adjusted using Final Domestic Demand Implicit Price Index
Overall departmental expenditures have grown by about 71%, in current dollars since 1996-97.
Annual Estimates Cycle
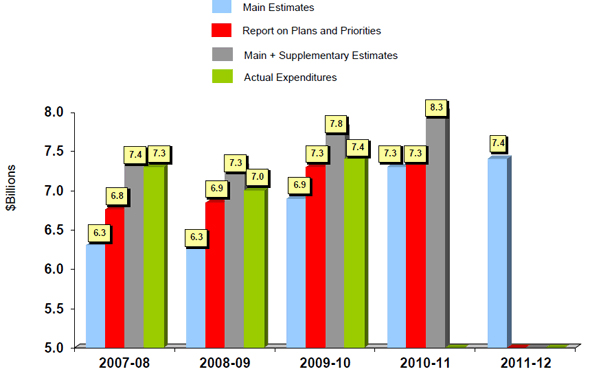
Text description of figure 7 - Annual Estimates Cycle
This is an image of a bar graph showing the dollar amounts in the annual estimates cycle for the department including the dollar amounts for the Main Estimates, Report on Plans and Priorities, Main and Supplementary Estimates and the actual expenditures for the fiscal years of 2007-08, 2008-09, 2009-10, 2010-11, 2011-12. The dollar amounts for the actual expenses for fiscal years 2010-11 and 2011-12 are not included. The dollar amounts for the Report on Plans and Priorities and the Main and Supplementary Estimates are not included for 2011-12.
For 2007-2008 the figures are: $6.3 billion, Main Estimates: $6.8 billion, Report on Plans and Priorities; $7.4 billion, Main and Supplementary Estimates; $7.3 actual expenses.
For 2008-2009 the figures are: $6.3 billion, Main Estimates: $6.9 billion, Report on Plans and Priorities; $7.3 billion, Main and Supplementary Estimates; $7.0 actual expenses.
For 2009-2010 the figures are: $6.9 billion, Main Estimates: $7.3 billion, Report on Plans and Priorities; $7.8 billion, Main and Supplementary Estimates; $7.4 billion actual expenses.
For 2010-2011 the figures are: $7.3 billion, Main Estimates: $7.3 billion, Report on Plans and Priorities; $8.3 billion, Main and Supplementary Estimates.
For 2011-2012 the figure is: $7.4 billion, Main Estimates.
Major Cost Drivers
Existing Federal Obligations
- Federal obligations in treaties and law (e.g. Constitution Act, 1867 and Indian Act); and major court interpretations (e.g. Guérin, Sparrow, Marshall, McIvor).
- Settlement of outstanding litigation (e.g. residential schools).
Demographic and Inflationary Pressures
- Young, growing and highly dispersed Aboriginal population.
- Price and population have grown by about four percent annually versus 2 percent growth cap.
Policy Commitments
- To resolve and accelerate claims settlements; to provide comparable services to First Nations; to foster independence (e.g. Self-Government, self-sufficiency); education; economic development.
- Environmental and resource management requirements - particularly in the North.
- Economic growth and stability.
Claims, Treaties and Rights
- Growing awareness and recognition of Aboriginal and treaty rights.
Devolution Issues
- Diseconomies of scale - community size and remoteness will impact cost of program delivery.
- Capacity at the community level to deliver programs effectively and efficiently.
Financial and Performance Management
The department has undertaken a number of initiatives to support stronger financial and performance management including:
- Extensive work on its Performance Measurement Framework;
- Performance measurement strategies for renewal of program authorities;
- The ongoing work of its Audit and Evaluation Committees;
- The work taking place through the implementation of the Policy on Transfer Payments to ensure funds transferred are managed with integrity, transparency and accountability;
- Implementation of the Chief Financial Officer Model embedding financial management advisors within sectors;
- Rigorous oversight and review of ongoing resource utilization through monthly financial status reports;
- Priorizing pressures through means of re-profiling, carry-forwards and in-year internal reallocation.
In Summary
- Indian and Northern Affairs Canada is one of several federal departments delivering programs and services to Aboriginal peoples and Northerners.
- The department's overall funding is increasing due to significant investments made in priority areas through successive budgets since 2006.
- Spending is impacted by deeply embedded cost drivers such as demographics, inflation, comparability, devolution/self-government, etc.
- The department has a number of measures in place to strengthen financial and performance management.