Specific Claims: Progress Report 2009-2010
In June 2007Footnote 1, the Government of Canada announced an action plan to speed up the resolution of specific claims in order to provide justice to First Nation claimants and certainty for all Canadians. Canada's Specific Claims Action Plan is delivering concrete results.
To learn more about the process for resolving these claims, read about the key terms used in this report and review the Frequently Asked Questions About Specific Claims.
On this page
What is Being Measured?
This report tracks overall progress in resolving specific claims in Canada between April 1, 2009 and September 30, 2009.
Progress: At a Glance
During this time, Canada addressed a total of 84 specific claims across the country. This number includes:
- 3 claims settled through negotiation (Search the settlement report in the reporting centre for more details)
- another 35 claims that were not accepted for negotiation on the basis that the claims did not give rise to any lawful obligations
- 46 claims that were addressed by means of file closure.
In addition, 34 claims were accepted for negotiation.
Quick Facts:
Before the launch of Canada's Specific Claims Action Plan, there was a logjam of claims stuck in the system. The inventory continued to grow because twice as many claims were submitted each year than were resolved. Review a graph showing the growth in the inventory from 1993 to 2007.
Since then, the situation has improved a great deal. For the first time ever, there are now more finalized claims in Canada than there are claims in the federal inventoryFootnote 2. The number of claims in the inventory has been reduced by a record total of 256 claims. This includes the 84 claims addressed in the first half of the current fiscal year (2009-2010). Review a graph outlining this year's results.
Past results
Compare this year's results with the record results from previous years.
| Fiscal Year | No. of Claims Addressed |
|---|---|
| 2007-2008 | 54 |
| 2008-2009 | 118 |
You Wanted to Know:
- How can I find out more about the claims that were settled this year?
- How many claims are still outstanding in Canada?
Results from March 31, 2008 to September 30, 2009
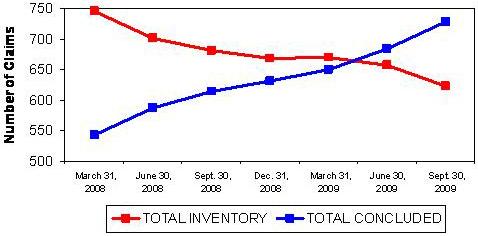
Description of Resolving Specific Claims: Results from March 31, 2008 to September 30, 2009
This graph shows how the overall federal inventory (shown in red) is decreasing and the number of finalized claims (shown in blue) is increasing. These results were tracked at key points throughout the first half of fiscal year 2009-2010.